domingo, 15 de junio de 2008

More Signs Of The Sun Slowing Down


In my post from yesterday, I highlighted a paragraph from a NASA press release which touched on one of the final findings of the soon to be ended Ulysses spacecraft mission to study the sun:

“Ulysses ends its career after revealing that the magnetic field emanating from the sun’s poles is much weaker than previously observed. This could mean the upcoming solar maximum period will be less intense than in recent history. “


A few months ago, I had plotted the Average Geomagnetic Planetary Index (Ap) which is a measure of the solar magnetic field strength but also daily index determined from running averages of eight Ap index values. Call it a common yardstick (or meterstick) for solar magnetic activity.


solar-geomagnetic-Ap Index

Click for a larger image


I had noted that there was a curious step function in 2005, almost as if something had “switched off”.


Today, since it is fathers day, and I get to do whatever I want, I chose to revisit this graph. Later I plan to take my children to launch model rockets, but for now, here are some interesting new things I’ve found.


First, I’ve updated the original Ap graph to June 2008 as you can see below.


Click for a larger image


Source data, NASA Space Weather Prediction Center:

http://www.swpc.noaa.gov/ftpdir/weekly/RecentIndices.txt


As you can see, the Ap Index has continued along at the low level (slightly above zero) that was established during the drop in October 2005. As of June 2008, we now have 32 months of the Ap hovering around a value just slightly above zero, with occasional blips of noise.


Since it is provided in the same dataset, I decided to also plot the smoothed Ap Index. I had noted to myself back in February that the smoothed Ap Index had dropped to minus 1.0. I figured it was just an artifact of the smoothing algorithm, but today that number remains there, and there doesn’t appear to be any change even though we’ve had a bit of noise in March that put the Ap Index back up to 10 for that month.


I also plotted my own 24 month smoothing window plot, shown in magenta.


Click for a larger image


I find it curious that the smoothed value provided by SWPC remains at -1. I figure if it is a software error, they would have noted and fixed it by now, and if they haven’t then perhaps they are standing by the number. Odd. One possibility may be that they are using a 12 month fixed window, instead of a moving window month to month. If so, then why show the -1.0 data vaues? Put nulls — in the dataset.


UPDATE: Astute reader Jorma Kaskiseiväs points out something I missed. The explanation is in the header for the dataset file, a short note: # Missing data: -1″. I was looking in the companion readme file for an explanation. Thanks for pointing this out. Surprising though that SWPC does not use a running average. Easy to do as I’ve shown.


While I was searching for something that could explain this, I came across this plot from NOAA’s NGDC which was used to illustrate solar storm frequency related to sunspots:


Click for original source image, a larger plot is here via FTP link.
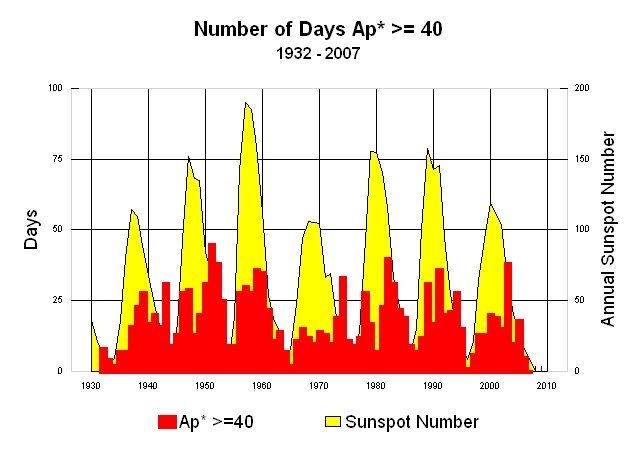

But what I found was most interesting was the data file they provided, which had the number of days in a year where the Ap Index exceeded 40. You can view that data file yourself here via FTP link. The accompanying readme file for the data is also available here.


What is most striking is that since 1932, there have not been ANY years prior to 2007 that have zero data. The closest was 1996:


1996 0 0 0 0 0 0 0 0 0 1 0 0 1


———————————————————–

YEAR JAN FEB MAR APR MAY JUN JUL AUG SEP OCT NOV DEC TOTAL


———————————————————–

2005 3 0 2 1 3 2 2 2 3 0 0 0 18


2006 0 0 1 2 0 0 0 1 0 0 0 1 5


2007 0 0 0 0 0 0 0 0 0 0 0 0 0


2008 0 0 0 0 0 0


Now we have almost two years.


Here is my plot of the above dataset:


Click for a larger image


I also decided to plot the 10.7 centimeter band solar radio flux, also a metric of solar activity. It is in the same SWPC dataset file as the Ap Index, in columns 8 and 9. Oddly the smoothed 10.7 CM flux value provided by SWPC also has dropped precipitously and stayed there. I also provided my own 24 month wind smoothed value which is plotted in magenta.


Click for a larger image


Like the smoothed Ap Index, it has also stayed that way a few months. NOTE: The data past Dec 2007 on the blue line from SWPC is not valid. The smoothed 24 month window is.


Either way it appears we continue to slide into a deeper than normal solar minima, one not seen in decades. Given the signs, I think we are about to embark upon a grand experiment, over which we have no control.


viernes, 13 de junio de 2008

NASA to Probe Sun “in situ”

Until the SOHO satellite was launched, astronomers had to be content to look through earth bound telescopes at the sun. Now that the sun is key to “the biggest threat facing mankind - climate change” it seems only sensible that NASA send a probe for direct measurment.

Now if we can just get Jim Hansen out of his office to look at some of the weather stations he keeps using in the GISS surface temperature database, we’ll really have something.

No word yet on whether Quizno’s will be putting a “Mmm…Toasty!” bumper sticker on the probe in exchange for scientific funding assistance.
From NASA Science News

For more than 400 years, astronomers have studied the sun from afar. Now NASA has decided to go there.
Right: An artist’s concept of Solar Probe Plus. [

The name of the mission is Solar Probe+ (pronounced "Solar Probe plus"). It's a heat-resistant spacecraft designed to plunge deep into the sun's atmosphere where it can sample solar wind and magnetism first hand. Launch could happen as early as 2015. By the time the mission ends 7 years later, planners believe Solar Probe+ will solve two great mysteries of astrophysics and make many new discoveries along the way.

The probe is still in its early design phase, called "pre-phase A" at NASA headquarters, says Guhathakurta. "We have a lot of work to do, but it's very exciting."

Johns Hopkins' Applied Physics Lab (APL) will design and build the spacecraft for NASA. APL already has experience sending probes toward the sun. APL's MESSENGER spacecraft completed its first flyby of the planet Mercury in January 2008 and many of the same heat-resistant technologies will fortify Solar Probe+. (Note: The mission is called Solar Probe plus because it builds on an earlier 2005 APL design called Solar Probe.)

At closest approach, Solar Probe+ will be 7 million km or 9 solar radii from the sun. There, the spacecraft's carbon-composite heat shield must withstand temperatures greater than 1400o C and survive blasts of radiation at levels not experienced by any previous spacecraft. Naturally, the probe is solar powered; it will get its electricity from liquid-cooled solar panels that can retract behind the heat-shield when sunlight becomes too intense. From these near distances, the Sun will appear 23 times wider than it does in the skies of Earth.

Above: A simulated view of the Sun illustrating the trajectory of Solar Probe+ during its multiple near-Sun passes.

The two mysteries prompting this mission are the high temperature of the sun's corona and the puzzling acceleration of the solar wind:

Mystery #1—the corona: If you stuck a thermometer in the surface of the sun, it would read about 6000o C. Intuition says the temperature should drop as you back away; instead, it rises. The sun's outer atmosphere, the corona, registers more than a million degrees Celsius, hundreds of times hotter than the star below. This high temperature remains a mystery more than 60 years after it was first measured.

Mystery #2—the solar wind: The sun spews a hot, million mph wind of charged particles throughout the solar system. Planets, comets, asteroids—they all feel it. Curiously, there is no organized wind close to the sun's surface, yet out among the planets there blows a veritable gale. Somewhere in between, some unknown agent gives the solar wind its great velocity. The question is, what?

"To solve these mysteries, Solar Probe+ will actually enter the corona," says Guhathakurta. "That's where the action is."

The payload consists mainly of instruments designed to sense the environment right around the spacecraft—e.g., a magnetometer, a plasma wave sensor, a dust detector, electron and ion analyzers and so on. "In-situ measurements will tell us what we need to know to unravel the physics of coronal heating and solar wind acceleration," she says.

Right: The re-designed Solar Probe+ spacecraft. [more]

Solar Probe+’s lone remote sensing instrument is the Hemispheric Imager. The “HI” for short is a telescope that will make 3D images of the sun’s corona similar to medical CAT scans. The technique, called coronal tomography, is a fundamentally new approach to solar imaging and is only possible because the photography is performed from a moving platform close to the sun, flying through coronal clouds and streamers and imaging them as it flies by and through them.

With a likely launch in May 2015, Solar Probe+ will begin its prime mission near the end of Solar Cycle 24 and finish near the predicted maximum of Solar Cycle 25 in 2022. This would allow the spacecraft to sample the corona and solar wind at many different phases of the solar cycle. It also guarantees that Solar Probe+ will experience a good number of solar storms near the end of its mission. While perilous, this is according to plan: Researchers suspect that many of the most dangerous particles produced by solar storms are energized in the corona—just where Solar Probe+ will be. Solar Probe+ may be able to observe the process in action and show researchers how to forecast Solar Energetic Particle (SEP) events that threaten the health and safety of astronauts.

Solar Probe+’s repeated plunges into the corona will be accomplished by means of Venus flybys. The spacecraft will swing by Venus seven times in six years to bend the probe’s trajectory deeper and deeper into the sun’s atmosphere. Bonus: Although Venus is not a primary target of the mission, astronomers may learn new things about the planet when the heavily-instrumented probe swings by.

“Solar Probe+ is an extraordinary mission of exploration, discovery and deep understanding,” says Guhathakurta. “We can’t wait to get started.”

Surprise: Leaves Maintain Temperature,

Surprise: Leaves Maintain Temperature, new findings may put dendroclimatology as metric of past temperature into question


Dendroclimatology: thermometer or hygrometer?

Hot climate or cold, tree leaves stay in comfort zone

From the Google Climate Discussion Group, see an article also in Science News

Paris, June 11; Agence France-Presse

A new study that shows their internal temperature remains constant at 21.4deg could challenge the way trees are used to determine historical climate data

The internal temperature of leaves, whether in the tropics or a cold-clime forest, tends toward a nearly constant 21.4 degrees Celsius, reports a study released today.

It had long been assumed that actively photosynthesising leaves - using energy from sunlight to convert carbon dioxide and water into sugar - are nearly as cold or hot as the air around them.

The new findings not only challenge long-held precepts in plant biology, but could upend climate models that use tree rings to infer or predict past and present temperature changes.

For decades, scientists studying the impact of global warming have measured the oxygen isotope ratio in tree-rings to determine the air temperature and relative humidity of historical climates.

Oxygen atoms within water molecules evaporate more or less quickly depending on the number of neutrons they carry, and the ratio between these differently weighted atoms in tree trunk rings has been used as a measure of year-to-year fluctuations in temperatures and rainfall.

“The assumption in all of these studies was that tree leaf temperatures were equal to ambient temperatures,” lead researcher Brent Helliker told AFP. “It turns out that they are not.”

Helliker and University of Pennsylvania colleague Suzanna Richter turned those assumptions upside down in examining 39 tree species, across 50 degrees of latitude ranging from sub-tropical Columbia to boreal Canada.

They compared current observed records of humidity and temperature against the isotope ratios in the trees, and found that tree leaves were internally cooler than surrounding air temperatures in warm climes, and warmer in cool climes.

Even more startling was that in all cases the average temperature - over the course of a growing season - was about 21degC.

“It is not surprising to think that a polar bear in northern Canada and a black bear in Florida have the same internal body temperature,” because both animals have internal thermostats to prevent overheating or freezing to death, he said.

“But to think that a Canadian black spruce and a Caribbean Pine have the same average leaf temperature is quite astonishing,” he added.

Tree leaves keep cool through constant evaporation and reducing sun exposure through leaf angles or reflective qualities. Warmth is gained by decreasing evaporation and increasing the number of leaves per branch.

All these tricks should be seen as evolutionary adaptations that help the trees attain a maximum of nutrients through optimal photosynthesis, Helliker said.

The fact that part of this adaptation occurs at the level of entire forest canopies, and not just within individual leaves, is one reason direct measurements of tree temperatures have been so hard.

The new findings, published in the British journal Nature, are bolstered by a recent study of a mixed species forest in Switzerland based on infrared thermal imaging.

Measured across an entire growing season, the forest canopy temperatures were found to be 4degC to 5degC higher than the cool, ambient air in the Swiss Alps.

miércoles, 11 de junio de 2008

Los últimos diez

Esta es la gráfica de la evolución de la temperatura global en los últimos diez años y unos cuantos meses (Enero 1998-Mayo 2008) que publica el instituto GISS de la NASA bajo la dirección de James Hansen (uno de los grandes jefes de la galaxia).

Para encontrar la figura hay que rebuscar un poco. Se entra en esta página, se pincha en la ventana de gráficos y se va para abajo hasta dar con ella.

Es una doble gráfica. Una se refiere a las temperaturas del aire en los continentes (negra) y otra a la global (roja), tierra y mar, en la que los valores del mar son los de las temperaturas de las aguas superficiales. Las gráficas indican las diferencias (o anomalías) de las temperaturas mensuales con respecto a las medias mensuales del período de referencia 1951-1980 (durante el cual la temperatura media global fue de más o menos 14ºC). Los valores de las anomalías varían entre 0ºC y 1ºC aproximadamente.

Los periódicos, a los que se supone les interesa la actualidad, no la publican nunca. No la encuentran.

posted by Antón Uriarte @ 1:12 AM

lunes, 9 de junio de 2008

Surprise: Earths’ Biosphere is Booming, Satellite Data Suggests CO2 the Cause


Eco Worriers: “CO2 is a pollutant!” Gaia: “Tell that to the biosphere.” Biosphere: “Yumm, burp!”

The SeaWiFS instrument aboard the Seastar satellite has been collecting ocean data since 1997. By monitoring the color of reflected light via satellite, scientists can determine how successfully plant life is photosynthesizing. A measurement of photosynthesis is essentially a measurement of successful growth, and growth means successful use of ambient carbon. This animation shows an average of 10 years worth of SeaWiFS data. Dark blue represents warmer areas where there tends to be a lack of nutrients, and greens and reds represent cooler nutrient-rich areas which support life. The nutrient-rich areas include coastal regions where cold water rises from the sea floor bringing nutrients along and areas at the mouths of rivers where the rivers have brought nutrients into the ocean from the land.
In praise of CO2
With less heat and less carbon dioxide, the planet could become less hospitable and less green
Lawrence Solomon
Financial Post, Don Mills, Ontario
Saturday, June 07, 2008

Planet Earth is on a roll! GPP is way up. NPP is way up. To the surprise of those who have been bearish on the planet, the data shows global production has been steadily climbing to record levels, ones not seen since these measurements began.

GPP is Gross Primary Production, a measure of the daily output of the global biosphere –the amount of new plant matter on land. NPP is Net Primary Production, an annual tally of the globe’s production. Biomass is booming. The planet is the greenest it’s been in decades, perhaps in centuries.

Until the 1980s, ecologists had no way to systematically track growth in plant matter in every corner of the Earth — the best they could do was analyze small plots of one-tenth of a hectare or less. The notion of continuously tracking global production to discover the true state of the globe’s biota was not even considered.

Then, in the 1980s, ecologists realized that satellites could track production, and enlisted NASA to collect the data. For the first time, ecologists did not need to rely on rough estimates or anecdotal evidence of the health of the ecology: They could objectively measure the land’s output and soon did — on a daily basis and down to the last kilometer.

The results surprised Steven Running of the University of Montana and Ramakrishna Nemani of NASA, scientists involved in analyzing the NASA satellite data. They found that over a period of almost two decades, the Earth as a whole became more bountiful by a whopping 6.2%. About 25% of the Earth’s vegetated landmass — almost 110 million square kilometres — enjoyed significant increases and only 7% showed significant declines. When the satellite data zooms in, it finds that each square metre of land, on average, now produces almost 500 grams of greenery per year.

Why the increase? Their 2004 study, and other more recent ones, point to the warming of the planet and the presence of CO2, a gas indispensable to plant life. CO2 is nature’s fertilizer, bathing the biota with its life-giving nutrients. Plants take the carbon from CO2 to bulk themselves up — carbon is the building block of life — and release the oxygen, which along with the plants, then sustain animal life. As summarized in a report last month, released along with a petition signed by 32,000 U. S. scientists who vouched for the benefits of CO2: “Higher CO2 enables plants to grow faster and larger and to live in drier climates. Plants provide food for animals, which are thereby also enhanced. The extent and diversity of plant and animal life have both increased substantially during the past half-century.”

From the 2004 abstract: Our results indicate that global changes in climate have eased several critical climatic constraints to plant growth, such that net primary production increased 6% (3.4 petagrams of carbon over 18 years) globally. The largest increase was in tropical ecosystems. Amazon rain forests accounted for 42% of the global increase in net primary production, owing mainly to decreased cloud cover and the resulting increase in solar radiation.

Lush as the planet may now be, it is as nothing compared to earlier times, when levels of CO2 and Earth temperatures were far higher. In the age of the dinosaur, for example, CO2 levels may have been five to 10 times higher than today, spurring a luxuriantly fertile planet whose plant life sated the immense animals of that era. Planet Earth is also much cooler today than during the hothouse era of the dinosaur, and cooler than it was 1,000 years ago during the Medieval Warming Period, when the Vikings colonized a verdant Greenland. Greenland lost its colonies and its farmland during the Little Ice Age that followed, and only recently started to become green again.

This blossoming Earth could now be in jeopardy, for reasons both natural and man-made. According to a growing number of scientists, the period of global warming that we have experienced over the past few centuries as Earth climbed out of the Little Ice Age is about to end. The oceans, which have been releasing their vast store of carbon dioxide as the planet has warmed — CO2 is released from oceans as they warm and dissolves in them when they cool — will start to take the carbon dioxide back. With less heat and less carbon dioxide, the planet could become less hospitable and less green, especially in areas such as Canada’s Boreal forests, which have been major beneficiaries of the increase in GPP and NPP.

Doubling the jeopardy for Earth is man. Unlike the many scientists who welcome CO2 for its benefits, many other scientists and most governments believe carbon dioxide to be a dangerous pollutant that must be removed from the atmosphere at all costs. Governments around the world are now enacting massive programs in an effort to remove as much as 80% of the carbon dioxide emissions from the atmosphere.

If these governments are right, they will have done us all a service. If they are wrong, the service could be all ill, with food production dropping world wide, and the countless ecological niches on which living creatures depend stressed. The second order effects could be dire, too. To bolster food production, humans will likely turn to energy intensive manufactured fertilizers, depleting our store of non-renewable resources. Techniques to remove carbon from the atmosphere also sound alarms. Carbon sequestration, a darling of many who would mitigate climate change, could become a top inducer of earthquakes, according to Christian Klose, a geohazards researcher at Columbia University’s Lamont-Doherty Earth Observatory. Because the carbon sequestration schemes tend to be located near cities, he notes, carbon-sequestration-caused earthquakes could exact an unusually high toll.

Amazingly, although the risks of action are arguably at least as real as the risks of inaction, Canada and other countries are rushing into Earth-altering carbon schemes with nary a doubt. Environmentalists, who ordinarily would demand a full-fledged environmental assessment before a highway or a power plant can be built, are silent on the need to question proponents or examine alternatives.

Earth is on a roll. Governments are too. We will know soon enough if we’re rolled off a cliff.

Radiosondes vs models

Finally, I want to show the status of the "direct" predictions and measurements of the temperature and to mention two graphs from Climate Audit.

This chart, taken from RealClimate.ORG, shows the overall warming expected from the doubling of CO2 concentrations from 280 ppm before the industrial revolution to 560 ppm expected around the year 2100 (assuming business-as-usual, i.e. a pretty constant rate of CO2 emissions in the future), as predicted by the GISS model E, dominated by the greenhouse effect.

Look in the middle of the picture, above the equator. You see the dark red "hot spot" over there. At the height (y-axis) corresponding to the pressure of 200 hPa, you are in the middle of the dark red cloud where the total warming should be not only higher than 3 °C (between 3 °C and 14.6 °C) but much higher than that, probably around 5 °C or so. This figure (5 °C) is roughly 1.5 times the surface warming (around 3 °C according to the IPCC's central figure and around 1.8 °C according to the picture above) - a classical feature of the greenhouse models.

Now, in 50 years, we add about 100 ppm of CO2 and we should therefore induce more than 1/3 of the effect of the CO2 doubling. So in 50 years, the place above the equator where the pressure is 200 hPa should heat up by more than 5 °C / 3 = more than 1.5 °C. (The CO2 emissions in this 50-year period were actually closer to the "earlier" emissions that should have a higher warming impact, because of the logarithmic slowdown: so my figure is probably an underestimate.) Does this significant warming actually occur in reality?
This is the actual graph of this tropospheric temperature record as measured by the Hadley Center's radiosondes (balloons). The net warming during the last 50 years is at most of order 0.2 °C and probably much smaller than that: Steve McIntyre calculated that since the beginning of the "satellite era" in 1979, the balloon trend has been actually negative (cooling). At any rate, it is very close to zero - and it is certainly much smaller than the 1.5 °C of warming predicted by the greenhouse models, as explained in the previous paragraph.

And yes, March 2008, the most recent month they have released, was the HadAT2 200 hPa tropical radiosondes' coolest month at least since the late 1950s (since January 1958) - one that was only matched by 1 month in the early 1970s, namely January 1972 (both Jan 1972 and Mar 2008 had -1.4 °C in the column, check the link in this paragraph).

This place above the equator is the most natural place where the temperature should be measured if your aim is to verify the greenhouse theory of the climate - simply because the signal is predicted to be maximized in this region. And the observations are smaller than the predictions by an order of magnitude or more.

Now, one order of magnitude is not a detail. If you accept that it is fair to compare economics and climatology because their "typical" predictions are comparably inaccurate (and I think that it is fair), the order-of-magnitude discrepancy between the theory and the observations is similar to a prediction by a group of economists who use their "consensus models" to forecast that the GDP will grow (or drop) by 40% a year - because of some effect - but the reality is only 4%. It's a pretty bad prediction, even in the fuzzy context of economics, isn't it?

Now, I want to emphasize that we must be a priori very open-minded because there can exist problems both with the observations as well as with the models. On the other hand, when you look at the weather balloons and the radiosondes they carry (see the picture on the left side), it is not too easy to imagine that there is some serious problem with them. These radiosondes measure the temperature (and the wind speed/direction) by thermometers and transmit the resulting numbers to the terrestrial radio receivers; see the Wikipedia text about radiosondes.

Try to think hard and invent an explanation why such a simple system would be sending warming trends that are 10 times smaller than the "real" ones (predicted by the models). I don't know of such an explanation. But once you find one, you should be ready to solve 1 or 2 similar puzzles - namely why the completely different satellite methodologies also lead to the same negligible warming trend if the "real" trend prescribed by the IPCC should be approximately 10 times faster.

I think it is sensible to expect an explanation what's wrong with the balloon and satellite numbers before someone's presentation of certain numbers from some computer games has a chance to be considered as "reality" by sane people.

Good luck. Before you find your ingenious method to solve these key puzzles, I will continue to think that the IPCC predictions have pretty much been falsified because the order-of-magnitude discrepancy we observe is pretty much the most serious discrepancy that we could a priori expect and if that were not enough for falsification, nothing would be enough. The qualitative agreement in one quantity of minor importance (related to winds) is not enough to confirm your models if more important predictions (temperature) fail.

Now, the balloon data may be very non-uniform and the "local noise" in them can be high. But it is fair to say that if the actual (accurate) thermometers can't demonstrate any significant warming trend over there, the "life on Earth" probably won't die because of such a warming either. A deadly fever is usually strong enough to be visible by thermometers, especially by the most accurate ones created for this purpose. ;-)

So think hard but try to imagine that your assumptions could be incorrect, after all.

Sherwood, Allen, and radiosondes

The media recently wrote far-reaching comments about the latest Nature Geophysics article by Steven Sherwood and Robert Allen (Yale University):
Warming maximum in the tropical upper troposphere deduced from thermal winds.
The authors - or at least the media - have claimed that a new method to "measure" the tropical tropospheric temperatures has removed all contradictions between the theoretical and empirical warming rates in the troposphere.

Recall that the greenhouse-dominated models predict rapid warming in the troposphere, roughly 10 km above the equator. The satellite measurements (UAH MSU, RSS MSU) show an actual warming rate that is at least 10 times slower than the theoretical predictions. The data from balloons and radiosondes they carry, for example the Hadley Center data, confirm the satellite figures. Detailed numbers will be discussed below.

That seems to be a problem. Every acceptable solution to this problem must either find serious errors in both the satellite and balloon data or a serious error in the theoretical models (or both).

Steven Sherwood and his pre-PhD student, Robert Allen, use a different strategy. They pretend that the discrepancy doesn't exist at all. How do they do it? Well, they want you to believe that the measurements of the temperatures don't exist. Instead, they propose their own, idiosyncratic, elaborated "measurement" of the tropospheric temperatures. Well, there is one additional immediate problem: it's not really their own method, as we will see. ;-)


Sherwood & Allen vs Pielke Sr

They look at some patterns in the thermal (?) westerly winds, manipulate them to obtain a rather continuous function, and claim that this function of the winds data is ... a measurement of temperature that is apparently better than the thermometers. Their method is not really original: it is a small subset of the methods discussed by Roger Pielke Sr and two co-authors in 2006 and especially by Pielke Sr and four co-authors in 2001. See also Pielke's comments about his priority.

So the idea is that instead of proving global warming, you prove global blowing :-) and then you argue that blowing and warming sound similar, especially according to your model that links the two. This strategy has the advantage that when the climate begins to cool down, you can also say that global blowing is the same thing as global cooling and the cataclysmic warming can continuously "rotate" into a new kind of catastrophic cooling. :-)

The problems with the particular conclusions by Sherwood and Allen have been discussed by
Roger Pielke Sr,
too. He is preparing a technical manuscript on that issue. The main drawback of their approach is circular reasoning. They want to demonstrate that the models are consistent with reality but what they actually call "reality" is extracted from the models, too.

More precisely, the relationship between the winds and the temperature is derived from the very same models that are shown to disagree with the actual temperature measurements by the balloons and satellites. So the arguments they show only support the compatibility of one particular theoretical prediction with the observations - namely the quantity describing winds as predicted by the very same models.

But a correct model should agree not only with one but with all observed quantities - especially with the temperature if this quantity is the main focus of your models. ;-)

The models also link this quantity related to winds to the temperature but the real measurements actually falsify the predicted temperature trend and the Yale authors don't change anything about that. To a large extent, they only demonstrate a "self-consistency" - which really means uniqueness of one prediction by the models that characterize the winds. It is not shocking that the predictions of such a model are self-consistent; it is much more non-trivial constraint that they should also be consistent with the real data.