lunes, 21 de septiembre de 2009

Artico azul y blanco


Un tema preferido de agitación propagandística suele ser en verano el deshielo del Artico. Este septiembre los medios se han exaltado y aparentan haberse escandalizado (veáse hoy mismo El País) porque dos mercantes noruegos de la compañía Beluga hubiesen podido navegar por la costa siberiana del Artico, desde Corea hasta Siberia, aprovechando el deshielo del final del verano. Acompañados, por si acaso, de dos rompehielos nucleares rusos, admitían y escribían algunos. Según una nota del presidente de la compañía naviera, Niels Stolberg, el tránsito por el paso del nordeste de dos cargueros de tal tamaño fue posible por la gran preparación y el magnífico trabajo de equipo de los capitanes y de su tripulación, así como de unas fiables predicciones meteorológicas. Pero si necesitaron del acompañamiento de dos formidables rompehielos rusos, aunque sólo fuese para hacerles compañía, no debió salirles barato el viaje.

La verdad es que deberíamos congratularnos por la hazaña tecnológica y reaccionar de forma opuesta a la desmoralización en la que continuamente los medios tratan de hundirnos (hundiéndose primero ellos). En el colmo del delirio verborreico, el diario británico Independent titulaba : “Un triunfo para el Hombre, un desastre para la Humanidad”.

Es verdad que, a diferencia del hielo marino invernal que rodea la Antártida, que tiende a aumentar, la tendencia en las dos últimas décadas del hielo veraniego en el Artico ha sido a disminuir. Es decir, que los mínimos han tendido a ser cada vez más bajos. Pero precisamente este año no ha ocurrido así. La publicación de la hazaña de los cargueros alemanes tapa lo que debería haber sido más noticiable: este verano del 2009 el hielo marino del Artico se ha encogido menos que el año pasado y el anterior. El Artico ha estado más blanco, menos azul. Arriba pongo los mapas del 19 de septiembre del 2007 y del 2009. Como se ve en la figura, en donde con colores morados se muestra la concentración del hielo, el paso del nordeste estuvo más impracticable entonces por una barrera entre Severnaya Zemlya y el continente, pero la extensión total del hielo marino era en la misma fecha bastante menor que la actual.

Ahora, a medida que se acorta el día y el Artico se sume en la oscuridad, las temperaturas de nuevo descienden muy por debajo de cero y los primeros metros de las aguas superficiales se congelan. La extensión de esta delgada cubierta de hielo marino, desde mediados de septiembre, aumenta. De hecho ha empezado ya a aumentar. Llegará a su máximo, de nuevo, a mediados de marzo, luego se reducirá y el ciclo, dirigido por el Sol, continuará.

ref. ArticoComparacion

viernes, 7 de agosto de 2009

ice ages

Long debate ended over cause, demise of ice ages – solar and earth wobble – CO2 not main driver

6 08 2009

From an Oregon State University Media Release (h/t to Leif Svalgaard)

Long debate ended over cause, demise of ice ages – may also help predict future


The above image shows how much the Earth’s orbit can vary in shape.
This process in a slow one, taking roughly 100,000 to cycle.
(Credit: Texas A&M University note: illustration is not to scale)

CORVALLIS, Ore. – A team of researchers says it has largely put to rest a long debate on the underlying mechanism that has caused periodic ice ages on Earth for the past 2.5 million years – they are ultimately linked to slight shifts in solar radiation caused by predictable changes in Earth’s rotation and axis.

In a publication to be released Friday in the journal Science, researchers from Oregon State University and other institutions conclude that the known wobbles in Earth’s rotation caused global ice levels to reach their peak about 26,000 years ago, stabilize for 7,000 years and then begin melting 19,000 years ago, eventually bringing to an end the last ice age.

The melting was first caused by more solar radiation, not changes in carbon dioxide levels or ocean temperatures, as some scientists have suggested in recent years.

viernes, 24 de abril de 2009

Global Warming: Il problema dell'espansione dei ghiacci antartici

Neanche i più convinti assertori del Global Warming possono negarlo: i ghiacci marini antartici stanno seguendo un trend di crescita impressionante. Si presenta una nuova teoria per spiegare l'evento in atto.


immagine articolo 20031 www.newscientist.com : L'anomalia della circolazione atmosferica antartica, che prevede maggiore freddo sul Mare di Ross, e maggiore caldo attorno al Continente, in particolare sul Sud America e sulla Penisola Antartica Occidentale.

Marco Rossi: 24-04-2009 ore 07:37

Possiamo seguirlo anche da soli, l'andamento di sviluppo dei ghiacci marini antartici, che sono in decisa crescita, contrastando così quella che è la teoria generalmente accettata riguardante il Global Warming.

Attualmente, l'estensione dei ghiacci antartici è superiore alla norma trentennale (1979-2009), di circa 1,2 milioni di kmq, ma quello che conta è anche il trend di crescita trentennale in costante aumento, al contrario di quanto stanno facendo i ghiacci artici.

A questo punto è d'uopo domandarsi il perché di questo andamento che si sta verificando in un momento nel quale le temperature di tutto il Mondo sono aumentate di alcuni decimi di grado nello stesso periodo (1979-2009).

Sulla rivista New Scientist è apparso uno studio di John Turner, del British Antartic Survey.

Secondo tale studio, i ghiacci marini antartici proseguiranno ad avanzare ancora per circa un decennio, prima di iniziare anch'essi a ritirarsi, tanto da attendersi una loro riduzione di circa un terzo entro la fine di questo Secolo.

La causa sarebbe il famoso "buco dell'Ozono", causato dalle emissioni di CFC, che avrebbe interferito sulla circolazione atmosferica polare meridionale.

In pratica, tale "buco" avrebbe portato ad un approfondimento di una circolazione depressionaria fredda sul Continente Antartico, con la caduta dei venti oceanici proprio in corrispondenza del Mare di Ross, dove massima è l'espansione dei ghiacci marini, e dove le temperature sono state in calo nell'ultimo trentennio.

Invece, tra il 40° ed il 60° parallelo sud, i venti oceanici avrebbero intensificato la loro velocità, causando così un forte riscaldamento sulla Penisola Antartica e sul Sud America, che, effettivamente, hanno registrato un impressionante trend termico in aumento.

Tuttavia, considerato che tale "buco" dovrebbe richiudersi entro 50 o 100 anni, anche la decrescita dei ghiacci antartici dovrebbe essere prevalente entro circa una decina di anni, fino a perdere un terzo circa della superficie totale entro la fine di questo Secolo.

Se questo è lo stato delle cose, dal punto di vista della circolazione, la spiegazione del "Buco dell'Ozono" quale causa principale presenta, dal nostro punto di vista, alcune contraddizioni.

Tale "buco", infatti, aumenterebbe la percentuale totale di radiazione solare in arrivo sull'Antartide, in quando la parte ultravioletta non verrebbe più filtrata dall'ozono, e giungerebbe ad incrementare il bilancio radiativo positivo.

Tutto ciò varrebbe soprattutto nei mesi estivi (ed infatti il mese di Gennaio è l'unico a non presentare significativi trend di crescita dei ghiacci), mentre nei mesi invernali, quando il Sole non c'è, il surplus di radiazione ultravioletta dovrebbe essere ininfluente sulla circolazione atmosferica polare.

Presentiamo comunque questa teoria come un tentativo di spiegazione di questa apparente anomalia nell'andamento del Global Warming.

miércoles, 1 de abril de 2009

Ni idea

La temperatura global media del aire en la superficie terrestre durante el siglo pasado, parte del anterior y parte de éste, ha seguido probablemente una evolución parecida a la de la curva que publica el Servicio Meteorológico Británico en conjunción con la Universidad de East Anglia.


El siglo XX ( de la curva en el XIX no hay que fiarse demasiado) se caracteriza por una subida de unas 8 décimas de grado ocurrida en dos períodos de unos 25 años cada uno: 1922-1945 y 1975-1998.

En las explicaciones oficiales del IPCC, la primera subida, 1922-1945, suele atribuirse fundamentalmente, al incremento de la intensidad solar. Entonces, las emisiones de CO2 eran muy pequeñas y no queda más remedio que atribuirla a otras causas. El Sol puede ser una. Puede.

Luego, acabada la segunda guerra mundial, el estancamiento térmico de 1945-1975, es atribuído al efecto "enfriador" de las emisiones contaminantes de azufre que ensombrecen la atmósfera y contrarrestan a la emisión de CO2, que ya entonces, debido al desarrollo industrial occidental y soviético, era importante. Hace falta creérselo, pero para eso están los modelos.

Posteriormente, entre 1975 y 1998, según la teoría oficial, el calentamiento provocado por las emisiones de CO2 superaron de nuevo el efecto de la suciedad sufurosa, que disminuyó, y de nuevo hubo un período de calentamiento.

Ahora, lo que causa perplejidad a los teóricos que atribuyen el calentamiento al CO2 es que las temperaturas llevan sin aumentar una decena de años, desde 1998. No se sabe por qué. Y si no sabemos esto, menos sabemos aún cómo evolucionará la temperatura media global en la próxima década. Ni idea.

Por eso resulta tan ridículo el objetivo que se han propuesto los mandamases políticos occidentales de —a base de controlar las emisiones de CO2— hacer que la temperatura global media no aumente más de 2ºC, cifra mágica que se inventó Merkel y que pomposamente suelen citar. No sé si son más creídos que idiotas, o al revés.
posted by Antón Uriarte @ 12:30 PM

lunes, 9 de febrero de 2009

Record global de cosechas en el 2008

Sunday, February 01, 2009

Record global de cosechas en el 2008


Según estimaciones de la FAO en el año 2008 se produjo un nuevo record en la producción global de cereales y los stocks de reserva aumentaron un 10 %. Las mejoras de la productividad agrícola y un clima global que no va a peor, sino más bien lo contrario, propiciaron este resultado. Incluso el incremento del CO2, fertilizando el aire, contribuyó en una parte, aún no bien determinada, al aumento de las cosechas (CO2 Science).

La nota menos positiva fue que la mayor parte del incremento ocurrió en los países desarrollados y el crecimiento en los países subdesarrollados fue muy pequeño, aunque no en todos. Hubo un boom en la producción cerealística del Sahel, la franja de países al sur del Sahara, en donde las abundantes lluvias propiciaron la excelente cosecha.

El hambre persiste en muchos países, pero no por razones climáticas sino esencialmente políticas, como en Zimbawe y Corea del Norte. Es criminal atribuirlo al clima.

domingo, 11 de enero de 2009

Pravda: Earth on the brink of an ice age


Pravda: Earth on the brink of an ice age
argues that those nice 12,000 warm years are approaching their end and the following 100,000 years will impress us with a new ice age. ;-)

Well, there is surely a potential for a 5-8 °C cooling in a few thousands years (or tens of thousands of years) - because the human civilizations that we know from the history textbooks already started in an unusually warm period (see the scary left side of the last, black graph on the image below) - but should we expect the cooling soon?
Update: David Archibald has reminded me of this picture (with an imminent icy prediction) from the 2000 article in Science by Berger and Loutre. Archibald included it in his cute book, Solar Cycle 24, as Figure 3.
Well, an imminent cooling is surely possible but the article doesn't look like the most convincing piece of science to me - both because of technical reasons, missing references, as well as entertaining, otherwise unimportant mistakes (for example, they claim that the Serbian astronomer Milutin Milanković was Czech).


But I would like to ask you what you know and think about the reconstruction of the climate record from the Milankovitch cycles. How good a fit can we actually obtain by combining the known astronomical cycles with well-chosen coefficients?

There are indications that the purely astronomical theory fails to describe very low-frequency signals - with approximately 100,000-year or 400,000-year periodicity - whose observed amplitude seems to be much larger than the theoretically predicted one: natural climate change at very long timescales seems to be much more intense than our theories say.

But when you ignore this 100k problem and 400k problem, can you actually reconstruct some nontrivial portions of the observed temperature profile or is the Milankovitch theory mostly a "proposal" that things should work like this that hasn't been satisfactorily verified?

There are many other effects one could imagine to be relevant, including new kinds of "sonic" cycles inside the Sun and/or varying intensities of cosmic rays caused by the motion of the solar system through different galactic patches.

I am probably going to play with Mathematica and Fourier series for a while.


Bonus: music and global warming

Because
the mostly natural warming since the 17th century has changed the sound of wooden instruments,
a statement that sounds funny but I find it perfectly plausible, Joe D'Aleo recommends Michael Mann to include violins in the list of his favorite proxies. The rapid increase of electronic instruments in the recent years will become just another proof of the hockey-stick-shaped, catastrophic man-made global warming. ;-)

Polar Sea Ice Changes are Having a Net Cooling Effect on the Climate

A guest post by Steven Goddard
One of the most widely discussed climate feedbacks is the albedo effect of polar sea ice loss. Ice has a relatively high albedo (reflectance) so a reduction in polar ice area has the effect of causing more shortwave radiation (sunlight) to be absorbed by the oceans, warming the water. Likewise, an increase in polar sea ice area causes more sunlight to be reflected, decreasing the warming of the ocean. The earths radiative balance is shown in the image below. It is believed that about 30% of the sunlight reaching the earth’s atmosphere is directly reflected - 20% by clouds, 6% by other components of the atmosphere, and 4% by the earth’s surface.
Radiation & Climate Slide
We all have heard many times that summer sea ice minimums have declined in the northern hemisphere over the last 30 years. As mentioned above, this causes more sunlight to reach the dark ocean water, and results in a warming of the water. What is not so widely discussed is that southern hemisphere sea ice has been increasing, causing a net cooling effect. This article explains why the cooling effect of excess Antarctic ice is significantly greater than the warming effect of missing Arctic ice.
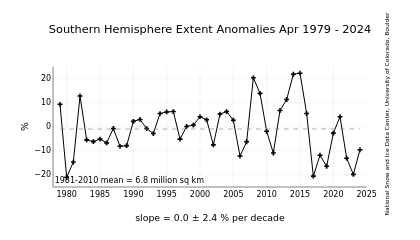
Over the last 30 years Antarctic sea ice has been steadily increasing, as shown below.
http://nsidc.org/data/seaice_index/images/s_plot.png

December is the month when the Antarctic sun is highest in the sky, and when the most sunlight reaches the surface. Thus an excess of ice in December has the maximum impact on the southern hemisphere’s radiative balance. In the Antarctic, the most important months are mid-October through mid-February, because those are months when the sun is closest to the zenith. The rest of the year there is almost no shortwave radiation to reflect, so the excess ice has little effect on the shortwave radiative (SW) balance.

This has been discussed in detail by Roger Pielke Sr. and others in several papers.
So how does this work? Below are the details of this article’s thesis.
1. As mentioned above, the Antarctic ice excess occurs near the December solstice when the sun is highest above the horizon. By contrast, the Arctic ice deficiency appears near the equinox - when the sun is low above the horizon. Note in the graph below, that Arctic ice reaches it’s minimum in mid-September - just when the sun is setting for the winter at the North Pole. While the September, 2008 ice minimum maps were dramatic, what they did not show is that there was little sunlight reaching the water that time of year. The deviation from normal did not begin in earnest until mid-August, so there were only a couple of weeks where the northern hemisphere SW radiative balance was significantly impacted. Thus the water in most of the ice-deficient areas did not warm significantly, allowing for the fast freeze-up we saw during the autumn.
The 2008 peak Arctic ice anomaly occurred near the equinox, when it had the minimum heating effect on the ocean.
http://www.ijis.iarc.uaf.edu/seaice/extent/AMSRE_Sea_Ice_Extent.png
By contrast, the peak Antarctic ice anomaly occurred at the December solstice, when it had a maximum cooling effect, as shown below.
http://nsidc.org/data/seaice_index/images/daily_images/S_timeseries.png
2. The next factor to consider is the latitude of the ice, which has a strong effect on the amount of solar insolation received. Arctic sea ice is closer to the pole than Antarctic sea ice. This is because of the geography of the two regions, and can be seen in the NSIDC images below.
http://nsidc.org/data/seaice_index/images/daily_images/N_daily_extent.png
http://nsidc.org/data/seaice_index/images/daily_images/S_daily_extent.png
Antarctic sea ice forms at latitudes of about 55-75 degrees, whereas most Arctic ice forms closer to the pole at latitudes of 70-90 degrees. Because Antarctic ice is closer to the tropics than Arctic ice, and the sun there reaches a higher angle above the horizon, Antarctic sea ice receives significantly more solar radiation in summer than Arctic sea ice does in its’ summer. Thus the presence or absence of Antarctic ice has a larger impact on the SW radiative balance than does the presence or absence of Arctic ice.
At a latitude of -65 degrees, the sun is about 40 degrees below the zenith on the day of the solstice. Compare that to early September negative anomaly peak in the Arctic at a latitude of 80 degrees, when the sun is more than 70 degrees below the zenith. The amount of solar radiation hitting the ice surface at those maxima is approximately 2.2 times greater in the the Antarctic than it is in the Arctic = cos(70) / cos(40) .
The point being again, that due to the latitude and date, areas of excess Antarctic ice reflect a lot of SW radiation back out into space, whereas deficient Arctic ice areas allow a much smaller quantity of SW radiation to reach the dark surface of water. Furthermore, in September the angle of incidence of the sun above the water is below the critical angle, so little sunlight penetrates the surface, further compounding the effect. Thus the Antarctic positive anomaly has a significantly larger effect on the earth’s SW balance than does the Arctic negative anomaly.
3. The next point is an extension of 2. By definition, excess ice is further from the pole than missing ice. Thus a 10% positive anomaly has more impact on the earth’s SW balance than does a 10% negative anomaly.
4. Due to eccentricity of the earth’s orbit, the earth is 3% closer to the sun near the December solstice, than it is during the June solstice. This further compounds the importance of Antarctic ice excess relative to Arctic ice deficiency.
All of these points work together to support the idea that so far, polar ice albedo feedback has been opposite of what the models have predicted. To date, the effect of polar albedo change has most likely been negative, whereas all the models predicted it to be positive. There appears to be a tendency in the climate community to discount the importance of the Antarctic sea ice increase, and this may not be appropriate.