jueves, 31 de julio de 2008

A encouraging response on satellite CO2 measurement from the AIRS Team

A encouraging response on satellite CO2 measurement from the AIRS Team

31 07 2008

Recently we’ve been discussing products from the AIRS satellite instrument (Atmospheric InfraRed Sounder) onboard the Aqua satellite. There has been quite a bit of interest in this because unlike the satellite temperature record that goes back to 1979, until now we have not had a complementary satellite derived CO2 record. We are about to have one, and much more.


Click image to see a slide show with this graphic in it (PDF)

I wrote to the AIRS team to inquire about when the satellite data on CO2, and other relevant products might be made public. All that has been released so far are occasional snippets of data and imagery, such as the short slide show above.

Here is the response I got from them:

Thank you for your interest in the AIRS CO2 data product.

We are still in the validation phase in developing this new product.
It will be part of the Version 6 data release, but for now those of us
working on it are intensively validating our results using in situ
measurements by aircraft and upward looking fourier transform IR
spectrometers (TCCON network and others).

The AIRS CO2 product is for the mid-troposphere. For quite some time
it was accepted theory that CO2 in the free troposphere is
“well-mixed”, i.e., the difference that might be seen at that altitude
would be a fraction of a part per million (ppmv). Models, which
ingest surface fluxes from known sources, have long predicted a smooth
(small)variation with latitude, with steadily diminishing CO2 as you
move farther South. We have a “two-planet” planet - land in the
Northern Hemisphere and ocean in the Southern Hemisphere. Synoptic
weather in the NH can be seen to control the distribution of CO2 in
the free troposphere. The SH large-scale action is mostly zonal.

Since our results are at variance with what is commonly accepted by he
scientific community, we must work especially hard to validate them.
We have just had a paper accepted by Geophysical Research Letters that
will be published in 6-8 weeks, and are preparing a validation paper.

We have global CO2 retrievals (day and night, over ocean and land, for
clear and cloudy scenes) spanning the time period from Sept 2002 to
the present. Those data will be released as we satisfactorily
validate them.

I suggest you Google “Carbon Tracker” for some interesting maps
generated using model atmospheres and data for CO2 sources. It shows
the CO2 weather in the lowest part of the atmosphere.

The big picture is that CO2 sources and sinks are in the planetary
boundary layer. Global circulation of CO2 occurs in the free
troposphere. Thus, PBL is local whereas free troposphere is
international.

———-
AIRS Team

With the suggestion of using the Google “Carbon tracker”, some readers might look at this response as a “dodge”. I don’t see it that way at all. Why? Because they are actively engaged in proving the instrument by doing a series of aircraft based measurements to validate the data the instrument on the spacecraft is seeing.

For example, read this paper from them:

First Satellite Remote Sounding of the Global Mid-Tropospheric CO2

These graphics show how hard they are working to validate the data from in situ measurements using airborne flask samples sent to a lab spectrometer: Read the rest of this entry »


Polar Ice Check - Still a lot of ice up there

30 07 2008

During our last check in, we had a look at northern Canada from the Arctic Circle to the North pole, and found we had quite a ways to go before we see an “ice free arctic” this year as some have speculated.

Today I did a check of the NASA rapidfire site for TERRA/MODIS satellite images and grabbed a view showing northern Greenland all the way to the North Pole.

There’s some bergy bits on the northeastern shore of Greenland, but in the cloud free area extending all the way to the pole, it appears to still be solid ice.

Click for a larger image - Note: image has been rotated 90° clockwise and sat view sector icon and time stamp added, along with “N” for north pole marker.

Link to original source image is here:
http://rapidfire.sci.gsfc.nasa.gov/realtime/single.php?T082121805

With more than half of the summer melt season gone, it looks like an uphill battle for an ice-free arctic this year.

Here is another view from today from the Aqua satellite:


Click for a larger image - Note: image has been rotated 90° counter- clockwise and sat view sector icon and time stamp added, along with “N” for north pole marker.

Source image is here:

http://rapidfire.sci.gsfc.nasa.gov/realtime/single.php?A082121655

This dovetails with a press release and news story about more ice than normal in the Barents Sea

From the Barents Observer: Read the rest of this entry »


Putting on AIRS

29 07 2008
Recently we’ve been discussing products for the AIRS satellite instrument (Atmospheric InfraRed Sounder) onboard the Aqua satellite. For example we’ve been looking at the only global image we can find of CO2 from its data made in 2003, wondering where the remainder of them are.

In my digging I discovered that the Apache webserver had open directory listings for folders, and this allowed me to explore a bit to see what I could find. in the \images folder I found a few images that I did not see published on the AIRS website. I’ve saved them to my server should they go offline, but have provided links to the original source URL.

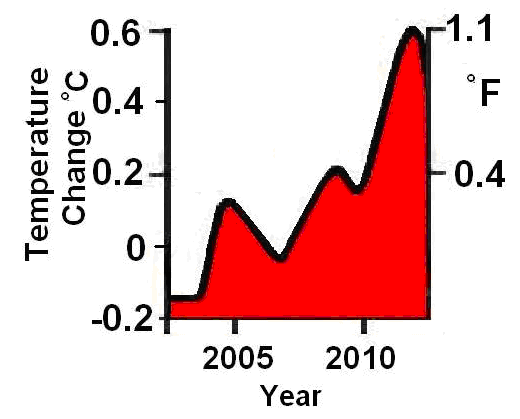
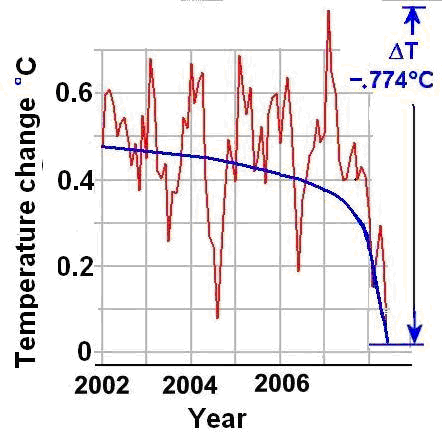
One for Sea Surface Temperature at the tropics seems interesting, though the data period is too short to be meaningful. Note that to eliminate cloud issues, the soundings are done when the satellite has a lookdown to “clear sky”.

Original source image: http://airs.jpl.nasa.gov/images/Aumann_SST_graph_543x409.jpg

I find it interesting that there is a slight global cooling of the oceans during this period of September 2002 to August 2004. The question is: where is the rest of the data and why has the AIRS group not been presenting it on their website? It is after all a publicly funded NASA program.

It is also interesting that this goes against one of the “signatures” of an AGW driven warming. Dr. David Evans writes in this essay: Read the rest of this entry »

viernes, 25 de julio de 2008

Compo and Sardeshmukh: Oceans a main driver of climate variability - it’s the heat AND the humidity.

Compo and Sardeshmukh: Oceans a main driver of climate variability - it’s the heat AND the humidity.

23 07 2008


Illustration only: not part of the paper

This paper has been out for a few days, and several people have alerted me to it. This new paper by Compo,G.P., and P.D. Sardeshmukh, 2008: Oceanic influences on recent continental warming. in the journal Climate Dynamics, is now in press. See the PDF here

This paper makes some significant claims regarding what is driving the observed climate changes. The emphasis is on the ocean as the main driving component, and the authors recognize that “a combination of natural and anthropogenic influences” may be at work. While they point to the oceans as a significant driver, they don’t offer much to explain what is driving the oceanic change.

Even so, this is a significant work, and I urge my visitors to read it, because it shows that GHG forcing is not the only occupant of the drivers seat. It also clearly illustrates the need to examine such cyclic ocean influences as the PDO and AMO more closely, and to consider them in projections of temperature.

Abstract:

“Evidence is presented that the recent worldwide land warming has occurred largely in response to a worldwide warming of the oceans rather than as a direct response to increasing greenhouse gases (GHGs) over land. Atmospheric model simulations of the last half-century with prescribed observed ocean temperature changes, but without prescribed GHG changes, account for most of the land warming. The oceanic influence has occurred through hydrodynamic-radiative teleconnections, primarily by moistening and warming the air over land and increasing the downward longwave radiation at the surface. The oceans may themselves have warmed from a combination of natural and anthropogenic influences.”

Beck on CO2 and Temperature: Oceans are the “dominant CO2 store”

Beck on CO2 and Temperature: Oceans are the “dominant CO2 store”

25 07 2008

Evidence of variability of atmospheric CO2 concentration during the 20th century
Geo-Ecological Seminar University of Bayreuth, 17th July 2008 (see here)
Ernst-Georg Beck, Dipl. Biol

Click for larger image with interactive popup links

Summary of the presentation (printable PDF available here)

In 1958 the modern NDIR spectroscopic method was introduced to measure CO2 concentrations in the atmosphere [Beck 2007]. In the preceding period, these measurements were taken with the old wet chemical method. From this period, starting from 1857, more than 90,000 reliable CO2 measurements are available, with an accuracy within ± 3 %. They had been taken near ground level, sea surface and as high as the stratosphere, mostly in the northern hemisphere. Comparison of these measurements on the basis of old wet chemical methods with the new physical method (NDIR) on sea and land reveals a systematic analysis difference of about minus 10 ppm.

Wet chemical analyses indicate three atmospheric CO2 maxima in the northern hemisphere up to approx. 400 ppm over land and sea since about 1812. The measured atmospheric CO2 concentrations since 1920 –1950 prove to be strongly correlated (more than 80 %) with the arctic sea surface temperature (SST).

A detailed analysis of the Atlantic Ocean water during the arctic warming since 1918 – 1939 by Wattenberg (southern Atlantic ocean) and Buch (northern Atlantic ocean) indicates a very similar state of the Atlantic Ocean (pH, salinity, CO2 in water and air over sea etc.) These data show the characteristics of the warm ocean currents (part of global conveyor belt) at that time, indicating a strong CO2 degassing from the Atlantic Sea, especially in the area of Greenland/Iceland and Spitsbergen. More than 360 ppm had been measured over the sea surface.

In 2004 Polyakov published evidence for a multi-decadal oscillation of the ocean currents in the arctic circle, showing a warm phase (strong arctic warming during 1918 –1940 with high temperatures in the Iceland/Spitsbergen area) similar to the current situation, and a cold phase (around 1900 and 1960). Today the Iceland/Spitsbergen area is known for a strong absorption of CO2.

This multi-decadal heating of the oceanic CO2 absorption area and larger parts of the Northern Atlantic Ocean was followed by an increase of the atmospheric carbon dioxide concentration to approx. 400 ppm during the 30s and approx. 390 ppm today. The abundance of plankton (13C) and other biota supports this view.

Who knew? Rachel Carson - climate change expert

Who knew? Rachel Carson - climate change expert

25 07 2008

NOTE: For those of you who don’t know, Rachel Carson has often been hailed as the “mother of the environmental movement” due to her book, Silent Spring, which is said to have resulted in the banning of the pesticide, DDT, worldwide. Before that book, she wrote another, The Sea Around Us, in which she proposes mechanisms for climate change.

What is most interesting is that, unlike with DDT, there is no placing blame on climate change to human influence. The mechanisms she proposes are all natural, all cyclic variation. No human created chemical influence (CO2) is mentioned. I wonder what she’d say today? Would she flip-flop and go with the flow of the current CO2 movement?

From Ed Sanders website, with some slight editing for readability and removal of the maddening glowing red background. (h/t to Steve McIntyre for the link) - Anthony


From the book, The Sea Around Us.

Copyright 1950, 1951, by Rachel Carson.

Reprinted by permission of Oxford- University Press, Inc.

The old-timers are right–winters aren’t what they were. And the reason may be gigantic tides deep under the sea that apparently change the climate of the whole earth.

The ocean comes alive in one of this year’s most fascinating books. This article is condensed from The Sea Around Us by Rachel Carson. A lilelong student of nature, Miss Carson is editor-in-chief of the U. S. Fish and Wildlife Service.

Day by day and season by season, the ocean dominates the world’s climate. Can it also be an agent in bringing about the long-period swings of climatic change that we know have occurred throughout the long history of the earth-the alternating periods of heat and cold, of drought and flood? There is a fascinating theory that it can.

This theory links events in the deep, hidden places of the ocean with the cyclic changes of eliminate and their effects on human history. It was developed by the distinguished Swedish oceanographer, Otto Pettersson, whose almost century-long life closed in 1941.

domingo, 20 de julio de 2008

Shifting of the Pacific Decadal Oscillation from its warm mode to cool mode assures global cooling for the next three decades.

Foreword: Don J. Easterbrook sent me this essay on Friday for publication here, but with the dustup over Monckton’s paper and the APS, I decided to hold off publishing it for a bit. For background, see Easterbrook’s web page here. - Anthony


Shifting of the Pacific Decadal Oscillation from its warm mode to cool mode assures global cooling for the next three decades.

Don J. Easterbrook, Dept. of Geology, Western Washington University, Bellingham, WA

Addressing the Washington Policymakers in Seattle, WA, Dr. Don Easterbrook said that shifting of the Pacific Decadal Oscillation (PDO) from its warm mode to its cool mode virtually assures global cooling for the next 25-30 years and means that the global warming of the past 30 years is over. The announcement by NASA that the (PDO) had shifted from its warm mode to its cool mode (Fig. 1) is right on schedule as predicted by past climate and PDO changes (Easterbrook, 2001, 2006, 2007) and is not an oddity superimposed upon and masking the predicted severe warming by the IPCC. This has significant implications for the future and indicates that the IPCC climate models were wrong in their prediction of global temperatures soaring 1°F per decade for the rest of the century.

Figure 1. Cooling of the Pacific Ocean and setting up of the cool-mode PDO. Sea surface temperature anomaly in the Pacific Ocean from April 14-21, 2008. The anomaly compares the recent temperatures measured by the Advanced Microwave Scanning Radiometer for EOS (AMSR-E) on NASA’s Aqua satellite with an average of data collected by the NOAA Pathfinder satellites from 1985-1997. Places where the Pacific was cooler than normal are blue, places where temperatures were average are white, and places where the ocean was warmer than normal are red. The cool water anomaly in the center of the image shows the lingering effect of the year-old La Niña. However, the much broader area of cooler-than-average water off the coast of North America from Alaska (top center) to the equator is a classic feature of the cool phase of the Pacific Decadal Oscillation (PDO). The cool waters wrap in a horseshoe shape around a core of warmer-than-average water. (In the warm phase, the pattern is reversed). Unlike El Niño and La Niña, which may occur every 3 to 7 years and last from 6 to 18 months, the PDO can remain in the same phase for 20 to 30 years. (NASA image by Jesse Allen, AMSR-E data processed and provided by Chelle Gentemann and Frank Wentz, Remote Sensing Systems. Caption by Rebecca Lindsey, adapted from a press release from NASA JPL).

Instead of a rise of 1°F during the first decade of this century as predicted by IPCC climate models (Fig 2), global temperatures cooled slightly for the past nine years and cooled more than 1°F this year (Fig 3). Global cooling over the past decade appears to be due to a global cooling trend set up by the PDO cool mode and a similar shift in the Atlantic. The IPCC’s prediction of a 1° F warming by 2011, will require warming of about 1° F in the next three years and unless that happens, the IPCC models will be proven invalid.

Figure 2. IPCC predicted warming.

Figure 3. Measured cooling.

As shown by the historic pattern of PDOs over the past century (Fig. 4) and by corresponding global warming and cooling, the pattern is part of ongoing warm/cool cycles that last 25-30 years. Each time the PDO mode has shifted from warm to cool or cool to warm, the global climate has changed accordingly. In 1977, the PDO shifted from cool mode to warm mode (Fig. 4) and set off the global warming from 1977 to 1998, often referred to as the “Great Climate Shift.” The recent shift from PDO warm mode to cool mode is similar to the shift that occurred in the mid-1940’s and resulted in 30 years of global cooling (Fig. 4). The global warming from ~1915 to ~1945 was also brought on by a mode shift in the PDO (Fig. 4). Every indication points continuation of the PDO patterns of the past century and global cooling for the next 30 years (Fig. 4). Thus, the global warming the Earth has experienced since 1977 appears to be over!

Figure 4. PDO indices, 1900-2008 with predictions to 2040.

sábado, 12 de julio de 2008

Global Warming Out, Global Cooling In

Four scientists: Global Warming Out, Global Cooling In

12 07 2008

http://www.angryconservative.com/home/Portals/0/Blog/GlobalWarming/global_warming_or_global_cooling.jpg

Alan Lammey, Texas Energy Analyst, Houston

Four scientists, four scenarios, four more or less similar conclusions without actually saying it outright — the global warming trend is done, and a cooling trend is about to kick in. The implication: Future energy price response is likely to be significant.

Late last month, some leading climatologists and meteorologists met in New York at the Energy Business Watch Climate and Hurricane Forum. The theme of the forum strongly suggested that a period of global cooling is about emerge, though possible concerns for a political backlash kept it from being spelled out.

However, the message was loud and clear, a cyclical global warming trend may be coming to an end for a variety of reasons, and a new cooling cycle could impact the energy markets in a big way.

Words like “highly possible,” “likely” or “reasonably convincing” about what may soon occur were used frequently. Then there were other words like “mass pattern shift” and “wholesale change in anomalies” and “changes in global circulation.”

Noted presenters, such as William Gray, Harry van Loon, Rol Madden and Dave Melita, signaled in the strongest terms that huge climate changes are afoot. Each weather guru, from a different angle, suggested that global warming is part of a cycle that is nearing an end. All agreed the earth is in a warm cycle right now, and has been for a while, but that is about to change significantly.

However, amid all of the highly suggestive rhetoric, none of the weather and climate pundits said outright that a global cooling trend is about to replace the global warming trend in a shift that could begin as early as next year.

Van Loon spoke about his theories of solar storms and how, combined with, or because of these storms, the Earth has been on a relative roller coaster of climate cycles. For the past 250 years, he said, global climate highs and lows have followed the broad pattern of low and high solar activity. And shorter 11-year sunspot cycles are even more easily correlated to global temperatures.

It was cooler from 1883 to 1928 when there was low solar activity, he said, and it has been warmer since 1947 with increased solar activity.

“We are on our way out of the latest (warming) cycle, and are headed for a new cycle of low (solar) activity,” van Loon said. “There is a change coming. We may see 180-degree changes in anomalies during high and low sunspot periods. There were three global climate changes in the last century, there is a change coming now.”

Meanwhile, Madden noted that while temperature forecasts longer than one to two weeks out has improved, “what has really gotten much better is climate forecasting … predicting the change in the mean,” he said.

And the drivers impacting climate suggest a shift to cooler sea surface temperatures, he said.

Perhaps the best known speaker was Colorado State University’s Gray, founder of the school’s famed hurricane research team. Gray spoke about multi-decade periods of warming and cooling and how global climate flux has been the norm for as long as there have been records.

Gray has taken quite a bit of political heat for insistence that global warming is not a man-made condition. Man-made carbon dioxide (CO2) is negligible, he said, compared to the amount of CO2 Mother Nature makes and disposes of each day or century.

“We’ve reached the top of the heat cycle,” he said. “The next 10 years will be hardly any warmer than the last 10 years.”

Finally, climate scientist Melita spoke of a new phase in the Pacific Decadal Oscillation.

“I’m looking at a new, cold-negative phase, though it won’t effect this summer, fall or winter ‘08,” he said.

Conference host, analyst and forecaster Andy Weissman closed the conference by addressing how natural gas prices and policy debates would be impacted by a possible climate shift that could leave the market short gas.

This would be especially problematic if gas use for power generation were substantially increased at the expense of better alternatives.

“If we’re about to shift into another natural climate cycle, we can’t do it without coal-fired generation. So the policy debate has to change,” he said. “Coal has to be back on the table if we’re ever going to meet our energy needs.”

As for natural gas: “Next year, may see a bit of price softening,” Weissman said. “After that, fogetaboutit!”.

jueves, 3 de julio de 2008

Northwest Passage: still impassable

Image rotated- click for source image. Credit: Terra/MODIS true color

Some reference views to help you get your bearings, here is what the area would be like if “ice free” as some folks are predicting to happen this summer:
impassable

im·pass·a·ble [im-pas-uh-buhl]

–adjective
1. not passable; not allowing passage over, through, along, etc.: Heavy snow made the roads impassable.

2. unable to be surmounted: an impassable obstacle to further negotiations.

There has been a lot of hype this year citing data which is suggesting that we’ll be able to navigate the Northwest Passage and some even so bold as to suggest a completely ice free Arctic Sea. You could say: “A picture is always worth 1000 data points.”

I’d say “impassable” fits this picture pretty well: