domingo, 11 de enero de 2009

Pravda: Earth on the brink of an ice age


Pravda: Earth on the brink of an ice age
argues that those nice 12,000 warm years are approaching their end and the following 100,000 years will impress us with a new ice age. ;-)

Well, there is surely a potential for a 5-8 °C cooling in a few thousands years (or tens of thousands of years) - because the human civilizations that we know from the history textbooks already started in an unusually warm period (see the scary left side of the last, black graph on the image below) - but should we expect the cooling soon?
Update: David Archibald has reminded me of this picture (with an imminent icy prediction) from the 2000 article in Science by Berger and Loutre. Archibald included it in his cute book, Solar Cycle 24, as Figure 3.
Well, an imminent cooling is surely possible but the article doesn't look like the most convincing piece of science to me - both because of technical reasons, missing references, as well as entertaining, otherwise unimportant mistakes (for example, they claim that the Serbian astronomer Milutin Milanković was Czech).


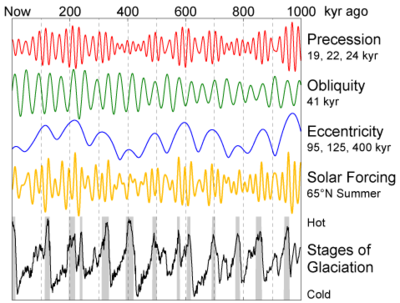
But I would like to ask you what you know and think about the reconstruction of the climate record from the Milankovitch cycles. How good a fit can we actually obtain by combining the known astronomical cycles with well-chosen coefficients?

There are indications that the purely astronomical theory fails to describe very low-frequency signals - with approximately 100,000-year or 400,000-year periodicity - whose observed amplitude seems to be much larger than the theoretically predicted one: natural climate change at very long timescales seems to be much more intense than our theories say.

But when you ignore this 100k problem and 400k problem, can you actually reconstruct some nontrivial portions of the observed temperature profile or is the Milankovitch theory mostly a "proposal" that things should work like this that hasn't been satisfactorily verified?

There are many other effects one could imagine to be relevant, including new kinds of "sonic" cycles inside the Sun and/or varying intensities of cosmic rays caused by the motion of the solar system through different galactic patches.

I am probably going to play with Mathematica and Fourier series for a while.


Bonus: music and global warming

Because
the mostly natural warming since the 17th century has changed the sound of wooden instruments,
a statement that sounds funny but I find it perfectly plausible, Joe D'Aleo recommends Michael Mann to include violins in the list of his favorite proxies. The rapid increase of electronic instruments in the recent years will become just another proof of the hockey-stick-shaped, catastrophic man-made global warming. ;-)

Polar Sea Ice Changes are Having a Net Cooling Effect on the Climate

A guest post by Steven Goddard
One of the most widely discussed climate feedbacks is the albedo effect of polar sea ice loss. Ice has a relatively high albedo (reflectance) so a reduction in polar ice area has the effect of causing more shortwave radiation (sunlight) to be absorbed by the oceans, warming the water. Likewise, an increase in polar sea ice area causes more sunlight to be reflected, decreasing the warming of the ocean. The earths radiative balance is shown in the image below. It is believed that about 30% of the sunlight reaching the earth’s atmosphere is directly reflected - 20% by clouds, 6% by other components of the atmosphere, and 4% by the earth’s surface.
Radiation & Climate Slide
We all have heard many times that summer sea ice minimums have declined in the northern hemisphere over the last 30 years. As mentioned above, this causes more sunlight to reach the dark ocean water, and results in a warming of the water. What is not so widely discussed is that southern hemisphere sea ice has been increasing, causing a net cooling effect. This article explains why the cooling effect of excess Antarctic ice is significantly greater than the warming effect of missing Arctic ice.
Over the last 30 years Antarctic sea ice has been steadily increasing, as shown below.
http://nsidc.org/data/seaice_index/images/s_plot.png

December is the month when the Antarctic sun is highest in the sky, and when the most sunlight reaches the surface. Thus an excess of ice in December has the maximum impact on the southern hemisphere’s radiative balance. In the Antarctic, the most important months are mid-October through mid-February, because those are months when the sun is closest to the zenith. The rest of the year there is almost no shortwave radiation to reflect, so the excess ice has little effect on the shortwave radiative (SW) balance.

This has been discussed in detail by Roger Pielke Sr. and others in several papers.
So how does this work? Below are the details of this article’s thesis.
1. As mentioned above, the Antarctic ice excess occurs near the December solstice when the sun is highest above the horizon. By contrast, the Arctic ice deficiency appears near the equinox - when the sun is low above the horizon. Note in the graph below, that Arctic ice reaches it’s minimum in mid-September - just when the sun is setting for the winter at the North Pole. While the September, 2008 ice minimum maps were dramatic, what they did not show is that there was little sunlight reaching the water that time of year. The deviation from normal did not begin in earnest until mid-August, so there were only a couple of weeks where the northern hemisphere SW radiative balance was significantly impacted. Thus the water in most of the ice-deficient areas did not warm significantly, allowing for the fast freeze-up we saw during the autumn.
The 2008 peak Arctic ice anomaly occurred near the equinox, when it had the minimum heating effect on the ocean.
http://www.ijis.iarc.uaf.edu/seaice/extent/AMSRE_Sea_Ice_Extent.png
By contrast, the peak Antarctic ice anomaly occurred at the December solstice, when it had a maximum cooling effect, as shown below.
http://nsidc.org/data/seaice_index/images/daily_images/S_timeseries.png
2. The next factor to consider is the latitude of the ice, which has a strong effect on the amount of solar insolation received. Arctic sea ice is closer to the pole than Antarctic sea ice. This is because of the geography of the two regions, and can be seen in the NSIDC images below.
http://nsidc.org/data/seaice_index/images/daily_images/N_daily_extent.png
http://nsidc.org/data/seaice_index/images/daily_images/S_daily_extent.png
Antarctic sea ice forms at latitudes of about 55-75 degrees, whereas most Arctic ice forms closer to the pole at latitudes of 70-90 degrees. Because Antarctic ice is closer to the tropics than Arctic ice, and the sun there reaches a higher angle above the horizon, Antarctic sea ice receives significantly more solar radiation in summer than Arctic sea ice does in its’ summer. Thus the presence or absence of Antarctic ice has a larger impact on the SW radiative balance than does the presence or absence of Arctic ice.
At a latitude of -65 degrees, the sun is about 40 degrees below the zenith on the day of the solstice. Compare that to early September negative anomaly peak in the Arctic at a latitude of 80 degrees, when the sun is more than 70 degrees below the zenith. The amount of solar radiation hitting the ice surface at those maxima is approximately 2.2 times greater in the the Antarctic than it is in the Arctic = cos(70) / cos(40) .
The point being again, that due to the latitude and date, areas of excess Antarctic ice reflect a lot of SW radiation back out into space, whereas deficient Arctic ice areas allow a much smaller quantity of SW radiation to reach the dark surface of water. Furthermore, in September the angle of incidence of the sun above the water is below the critical angle, so little sunlight penetrates the surface, further compounding the effect. Thus the Antarctic positive anomaly has a significantly larger effect on the earth’s SW balance than does the Arctic negative anomaly.
3. The next point is an extension of 2. By definition, excess ice is further from the pole than missing ice. Thus a 10% positive anomaly has more impact on the earth’s SW balance than does a 10% negative anomaly.
4. Due to eccentricity of the earth’s orbit, the earth is 3% closer to the sun near the December solstice, than it is during the June solstice. This further compounds the importance of Antarctic ice excess relative to Arctic ice deficiency.
All of these points work together to support the idea that so far, polar ice albedo feedback has been opposite of what the models have predicted. To date, the effect of polar albedo change has most likely been negative, whereas all the models predicted it to be positive. There appears to be a tendency in the climate community to discount the importance of the Antarctic sea ice increase, and this may not be appropriate.

CO2 en el 2008: ¿ incremento mínimo ?

El dato preliminar del incremento atmósferico de CO2 en el 2008, registrado en el Mauna Loa (observatorio oficial de sus mediciones), ha sido el más bajo desde que comenzaron las mediciones en 1959: 0,24 partes por millón (ppm). (CO2 trends) .

Pero ...quizás sea un error. Es extraño que en la tabla Mauna Loa CO2 monthly mean data la cifra del mes de Diciembre sea la misma exactamente que la de Noviembre: 384,11 ppm.

Las emisiones de CO2 por quema de combustibles fósiles habrán sido de unas 29 gigatoneladas (ver gráfica abajo), que de haberse quedado por completo en la atmósfera hubiesen aumentado la concentración de CO2 en unas 3,7 partes por millón. Así que falta en el aire la mayor parte del CO2 añadido en el 2008, que habrá sido absorbido por el mar y la biomasa terrestre (suelos y vegetación). Más que de costumbre.


Gt (Gigatonelada) = mil millones de toneladas
2,12 Gigatoneladas de carbono (7,8 Gigatoneladas de CO2) equivalen a 1 ppm en la concentración atmosférica de CO2.


Los interesados sobre la variabilidad del aumento del CO2 pueden leer :
Incremento del CO2

ref. datos de la gráfica: EIA - International Energy Data and Analysis .


Riscaldamento globale, un'ipotesi diversa. Parte I: il minimo di Gleissberg

Il ritardo del nuovo ciclo solare potrebbe indurre a un ripensamento circa alcune idee riguardanti le cause dei cambiamenti climatici.


immagine articolo 19372 Confronto fra l'andamento dei cicli solari 22-23 e 3-4, secondo l'ipotesi che, nei prossimi anni, prevede una replica del minimo di Dalton. Fonte: http://ncwatch.typepad.com. Clickare l'immagine per ingrandire.

Stefano Di Battista: 10-01-2009 ore 11:19

Il ritardo con cui il ciclo solare 24 si sta manifestando ha riportato l'attenzione sul ruolo dell'astro quale motore del clima terrestre: una più approfondita conoscenza di tali connessioni potrebbe infatti rimettere in discussione alcune idee circa il riscaldamento globale di origine antropica. Di qui le ricerche e gli studi, attraverso cui la comunità scientifica si sta interrogando; in particolare, si cercano le prove riguardanti il minimo di Gleissberg che, se avesse fondamento nei suoi presupposti teorici, potrebbe condurre la Terra a un accentuato raffreddamento. Alla base dei nuovi scenari sta il comportamento del Sole negli ultimi anni: non è chiaro cosa stia avvenendo, e ciò è motivo di interpretazioni diverse, che qui si riassumono per sommi capi.

Debolezza del ciclo 24 Il 4 gennaio 2008, alle alte latitudini solari, è comparsa una macchia a polarità invertita, indizio del nuovo ciclo, il 24º dal 1755, anno da cui inizia la classificazione numerica. Tuttavia l'attività dell'astro si è mantenuta bassa, al contrario delle attese, che indicavano un pronunciato massimo entro il 2010 (poi spostato al 2011, al 2012 e ancora oltre). Nell'ottica di tale massimo, ci si attendeva una progressiva crescita dell'attività solare; invece, il 2008 (266 giorni secondo i dati preliminari) è risultato l'anno con meno macchie (Spotless days) dal 1913, il 4º per scarsità dal 1849 in una classifica che vede, al 19º posto, anche il 2007 (163 giorni). Ciò ha fatto postulare che il ciclo 24 possa rassomigliare ai cicli di fine Ottocento - inizio Novecento, quando l'attività del Sole era meno marcata dell'attuale.

Ampiezza del ciclo 23 Il 28 marzo 2008 la sonda SOHO (Solar and Heliospheric Observatory) ha confermato l'apparizione sul Sole d'un gruppo di macchie della precedente polarità a latitudini equatoriali: per gli specialisti questa è la prova che il ciclo 23 non è ancora esaurito. In effetti, nel trapasso da un ciclo all'altro, la sovrapposizione fra il vecchio e il nuovo è cosa normale; tuttavia, se il ciclo 23, iniziato nel maggio 1996, non fosse terminato, starebbe per raggiungere l'ampiezza del ciclo 4 (1784-'98) confermando, almeno in parte, la teoria del ciclo di Gleissberg.

Detto ciò, si rendono necessarie alcune considerazioni aggiuntive. La scarsità di macchie solari di per sé non ha incidenza sul clima terrestre; esse non sono che un indicatore dell'attività magnetica dell'astro, nel senso che appaiono in numero elevato quanto più il Sole è attivo, e viceversa. È appurato che lunghi minimi solari, caratterizzati dalla scomparsa quasi totale delle macchie, sono coincisi con fasi fredde ultrasecolari, tant'è che «la corrispondenza tra due segnali non periodici, cioè i documenti della storia del clima e il profilo della variabilità solare nel lungo periodo, ben si adattano l'uno all'altro, quasi come una chiave e la sua toppa» [Eddy, pp. 195-196].

Se il ciclo 23 non è esaurito (si avvierebbe quindi a raggiungere i 13 anni), la corrispondenza col ciclo 4 (durato 13,6 anni) permetterebbe di formulare previsioni a lungo termine. Secondo la teoria di Gleissberg, cicli molto ampi (e il ciclo 4 è stato il più ampio tra quelli numerati) preludono a una fase di quiescenza solare (vedi nota), che si mostrerebbe nei cicli successivi, a partire dunque dal 24º o, più probabilmente, dal 25º. L'analogia è data dal minimo di Dalton (1798-1823), che si produsse coi deboli cicli 5 e 6 e che corrispose alla fase terminale della Piccola età glaciale, quando molte morene alpine raggiunsero il loro limite storico. Ma c'è un'ulteriore complicazione, fra le tante che rendono estremamente difficile interpretare il ruolo del Sole.

Il ciclo perduto Analizzando la scarsità di osservazioni successive al 1790 (imputate all'instabilità socio politica derivante dalla Rivoluzione francese), si è ipotizzato che l'apparente lunga durata del ciclo 4 sia stata, invece, il risultato della sovrapposizione di due cicli: uno denominato 3' (1784-'93) e un debole, e non riconosciuto, ciclo 4 (1793-'99), circostanza che farebbe leggermente postdatare l'avvio del ciclo 5 (1799 in luogo del 1798). Il declino eccezionalmente lungo del ciclo 4 (fase catastrofe: 1791-'98) pertanto, sarebbe da inquadrare in modo diverso rispetto a quanto ritenuto finora [Usoskin, pp. 257 e 259].

A prescindere dalle implicazioni storiche e dai risvolti astrofisici che questa lettura può comportare, lo spunto riguardante le carenze della documentazione conduce a una riflessione circa il minimo attuale. Tra il 21 luglio e il 10 settembre 2008 si era creduto di archiviare una sequenza spotless di 51 giorni, che sarebbe stata la più lunga dal 1913 e la quarta dal 1849; l'osservatorio di Rimavská Sabota (Slovacchia) ha tuttavia riconosciuto un gruppo di macchie che hanno interrotto la sequenza al 20 agosto (31 giorni). Ciò non va a inficiare l'importanza del minimo attuale, ma apre anzi una questione cruciale, ovvero: quanto sono attendibili, secondo i parametri in uso, i minimi di fine Ottocento e inizio Novecento, per non parlare di quelli del XVII e XVIII secolo, quando le tecniche di rilevamento erano notevolmente meno affinate delle attuali? Quante altre macchie, del tipo di quelle messe in evidenza nel 2008, possono esser sfuggite agli astronomi dell'epoca? Perciò: la fase di quiescenza odierna è esattamente confrontabile con quelle passate, oppure è sottostimata per via d'una più capillare capacità di controllo?

Nessuna risposta è al momento opportuna, anche perché gli stessi sostenitori delle implicazioni climatiche derivanti dall'attività solare mettono in luce una serie di incongruenze che ancora attendono una spiegazione.

Note
Tale quiescenza determinerebbe anche una debolezza del vento solare, esponendo così la Terra a una maggiore ingerenza dai raggi cosmici: da qui l'ulteriore teoria di Henrik Svensmark ed Eigil Friis-Christensen, del Dansk Rumforskningsinstitut di Copenaghen, a parere dei quali ciò indurrebbe un aumento della nebulosità terrestre.

Bibliografia
J.A. EDDY, Il clima e il ruolo delle condizioni solari, in R.I. ROTBERG, T.K. RABB (a cura di), Clima e storia, Milano, 1984, pp. 170-197.
I.G. USOSKIN, K. MURSULA, G.A. KOVALTSOV, The start of the Dalton minimum: was one sunspot cycle lost in late XVIII century?, in H. SAWAYA-LACOSTE (editor), Proceedings of the Second Solar Cycle and Space Weather Euroconference (Vico Equense, Italy, 24-29 settembre 2001), Noordwijk, 2002, pp. 257-260.

Riscaldamento globale, un'ipotesi diversa. Parte II: le previsioni di Hathaway

immagine articolo 19419 Le ultime due previsioni (ottobre 2008 e gennaio 2009) elaborate da David H. Hathaway del NASA Marshall Space Flight Center, che riducono l'ampiezza del ciclo 24: il massimo scende al di sotto di quello del ciclo 23 (fonte:
www.Klimadebat.dk . Clickare sull'immagine per ingrandire).

Stefano Di Battista: 11-01-2009 ore 21:02

I sostenitori del riscaldamento globale antropico hanno una posizione perentoria: «Tutte le teorie che hanno cercato di attribuire alla radiazione solare un ruolo determinante sull'andamento delle temperature nell'ultimo secolo e, in particolare degli ultimi 50 anni, non reggono» [Caserini, p. 103]. Eppure ci sono studi che mostrano come la componente solare spieghi il 74% dell'evoluzione termica dell'emisfero boreale dal 1610 al 1800 e il 56% di quella successiva, e pur avvertendo che solo un terzo degli 0,36 °C di aumento registrati dal 1970 sono attribuibili alla variabilità solare, concludono che essa «può aver giocato un ruolo più grande nel recente mutamento di temperature globali di quello che finora è stato riconosciuto» [Lean, p. 3198].

Il filo che lega Sole e clima terrestre sembra correlato ad alcune componenti che possono amplificarne, oppure limitarne, gli effetti. Nella sintesi seguente si descrivono quelle su cui, al momento, si concentrano le maggiori attenzioni.

Fasi solari Il ciclo delle macchie ha una periodicità di 11,2 anni (ciclo di Schwabe); si tratta d'un dato medio, poiché sono documentati cicli di 9 anni e altri di 14. Il passaggio da un ciclo all'altro è determinato dall'inversione della polarità delle macchie, il che implica che ogni 22 anni circa (ciclo di Hale) il campo magnetico del Sole torni allo stato iniziale. La durata dei cicli di Schwabe è correlata al ciclo di Gleissberg, di 80-90 anni: ogni fase alternerebbe cicli lunghi, in cui il Sole si mostra meno dinamico, e cicli corti, in cui l'attività magnetica s'intensifica. A supporto di tale ipotesi si fa notare come i cicli 16-22 (si esclude il 23 poiché ancora non esiste certezza circa il suo esaurimento) abbiano avuto una durata media di 10,4 anni e un basso numero di Spotless days, mentre i cicli 10-15 (1856-1923), quelli cioè per cui risulta più certo il conteggio delle macchie (la compilazione storica regolare ebbe inizio nel 1849, durante il ciclo 9), siano durati in media 11,3 anni e con un più alto numero di Spotless days (*),

Eruzioni vulcaniche Un grande capitolo, su cui esiste accordo pressoché unanime nel mondo scientifico, è quello dell'influenza sul clima delle polveri vulcaniche immesse nella stratosfera. Il Dust veil index (DVI) è stato elaborato per misurarne la concentrazione. Se si scorrono le tavole cronologiche di tale indice, si noterà come il minimo di Dalton sia coinciso con una forte attività vulcanica: fra il 1799 e il 1822 (cicli 5 e 6) ci furono non meno di 12 eruzioni [Lamb, pp. 434-435], tra cui quella del Cotopaxi (Ecuador) nel 1803 (DVI = 1.100 circa) e quella del Tambora (Indonesia) nel 1815 (DVI = 3.000). Il XIX secolo e l'inizio del XX furono caratterizzati da un'altissima attività vulcanica (**), ma poi subentrò una stasi e «poiché le eruzioni vulcaniche hanno segnato un minimo marcato tra il 1912 e il 1948, tale situazione ha certamente favorito il sensibile aumento della temperatura verificatosi in quel periodo» [Pinna, p. 174].

Teleconnesioni Si ritiene che, durante le fasi di forte attività magnetica del Sole, ENSO (El Niño Southern Oscillation) sia preponderante rispetto alla Niña e viceversa. A partire dal 1976, in coincidenza coi cicli 22 e 23, ENSO avrebbe avuto un non trascurabile impatto sulle variazioni climatiche. Stando al ciclo di Gleissberg, nei prossimi anni è attesa una prevalenza della Niña, con conseguente moderazione degli eccessi climatici notati a cavallo del XXI secolo. Anche la PDO (Pacific Decadal Oscillation) e la NAO (North Atlantic Oscillation) sembrano correlate al ciclo solare, ed entrambe starebbero entrando in una fase negativa (fase fredda), che andrebbe a sommarsi alla debolezza di ENSO, amplificando gli effetti d'un minimo solare sul quadro termico terrestre. Si è poi tentato di mettere in relazione al ciclo undecennale anche la QBO (Quasi-Biennal Oscillation), ma con risultati di difficile valutazione.

Questo insieme di elementi potrebbe spiegare, almeno in parte, il riscaldamento dell'ultimo secolo e fornire indicazioni probabilistiche sulla futura evoluzione del clima terrestre. In questo campo di studi, mettendo in relazione l'indice geomagnetico del Sole e lo Zürich Sunspot Number (ovvero il conteggio delle macchie), si è scoperto che esiste una forte somiglianza (di segno inverso, però) fra il minimo di Maunder (1645-1723) e il grande massimo solare del XX secolo. Nel 1923 infatti (inizio del ciclo 16), si evidenzia una brusca variazione nell'ampiezza e nella durata della curva di lungo periodo che descrive l'attività solare; essa raggiunge l'apice intorno al 1960, poi comincia a decrescere [Duhau, pp. 8-9 e 14], in una parabola che dovrebbe riportarla al punto zero proprio con l'inizio del ciclo 24.

Ciò che, a oggi, si può affermare, è che il ciclo 23 è stato più lungo dei precedenti ma caratterizzato da meno macchie solari. Quanto al ciclo 24, le proiezioni elaborate negli scorsi anni lo descrivevano come il più forte degli ultimi secoli; la comparsa del nuovo massimo, invece, è stata via via posticipata e ridimensionata. David H. Hathaway, del Marshall Space Flight Center, considerato il maggior esperto mondiale in fatto di previsioni dell'attività solare, per tre volte ne ha riveduto l'ampiezza (Maximum sunspot number); ecco i dati che ha proposto:
145 (nel marzo 2006)
137 (nell'ottobre 2008)
104 (nel gennaio 2009)

Sorprendente l'ultima, forte correzione, ad appena tre mesi dalla precedente che, se confermata, condurrebbe a un debole ciclo 24 come non si verifica dal ciclo 16 (1923-'33). D'altro canto, la quiescenza del Sole nel 2007-'08 e in quest'inizio del 2009 è fonte di incertezze, che vanno a rafforzare la possibilità che il ciclo di Gleissberg conduca a un accentuato minimo verso il 2030: cosa questa che, combinandosi con le fasi negative delle principali teleconnessioni, potrebbe determinare un progressivo raffreddamento del clima terrestre, in antitesi a quanto postulato dalla teoria del riscaldamento globale antropico. Una possibilità, si è detto, che trova fondamento in una ciclicità abbastanza chiara dell'attività solare, la cui componente magnetica resta tuttavia un sistema caotico e non lineare, sull'evoluzione della quale è bene esercitare cautela: altrimenti si rischia quella che è stata definita ciclomania [Le Roy Ladurie, p. 13], che pretenderebbe di descrivere il clima futuro con estrapolazioni statistiche molto lontane dalla realtà dei fatti.

Note
Questa corrispondenza è resa dal grafico pubblicato a corredo dell'articolo http://www.meteogiornale.it/news/read.php?id=19367.
* Si è anche ipotizzato che l'intensità del vento solare, influenzando le linee di flusso del campo magnetico terrestre, possa modulare l'attività vulcanica; si tratta però d'una supposizione rimasta finora a livello accademico.

Bibliografia
S. CASERINI, A qualcuno piace caldo, Milano, 2008.
S. DUHAU, C. DE JAGER, The Solar Dynamo and Its Phase Transitions during the Last Millennium, in «Solar Physics», vol. 250, n. 1 (2008), pp. 1-15 (doi: 10.1007/s11207-008-9212-x).
H.H. LAMB, Climate: Present, Past and Future, vol. I, Londra, 1972.
J. LEAN, J. BEER, R. BRADLEY, Reconstruction of solar irradiance since 1610: Implications for climate change, in «Geophysical Research Letters», vol. 22, n. 23 (1995), pp. 3195-3198.
E. LE ROY LADURIE, Tempo di festa, tempo di carestia, Torino, 1982.
M. PINNA, Le variazioni del clima, Milano, 1996.

Parte I: http://www.meteogiornale.it/news/read.php?id=19372