miércoles, 31 de diciembre de 2008

The Ice in Greenland is Growing

Old Radar Sites In Greenland Show Icecap Growth Over the Years

(And let’s not forget what we’ve learned about the temperature reporting from the DEW line Radar Stations - Anthony)

By Joseph D’Aleo, CCM, AMS Fellow

Though the ice may be melting around the edges of the Greenland Icecap in recent years during the warm mode of the AMO much as it did during the last warm phase in the 1930s to 1950s, snow and ice levels continue to rise in most of the interior. Johannessen in 2005 estimated an annual net increase of ice by 2 inches a year.

greenland-ice-growth

(Above: Recent Ice-Sheet Growth in the Interior of Greenland, Ola M. Johannessen, Kirill Khvorostovsky, Martin W. Miles, Leonid P. Bobylev, Science Express on 20 October 2005 Science 11 November 2005: Vol. 310. no. 5750, pp. 1013 � 1016, DOI: 10.1126/science.1115356)

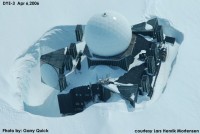
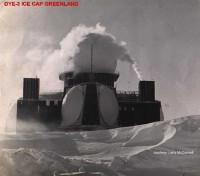
A Canadian Icecap emailer noted during the cold war there were two massive radar sites built on the Greenland icecap now abandoned. They are called Dye-2 and Dye-3. When built they sat high above the snow, recent pictures show how the snow is building up around them, proving the snow build-up in recent times. This demonstrates this snow accumulation over time.

Dye-2 and 3 were among 58 Distance Early Warning Line radar stations built by America between 1955-1960 across Alaska, Canada, Greenland and Iceland at a cost of billions of dollars. Their powerful radars monitored the skies constantly in case Russia decided to send bombers towards America. After extensive studies in late 1957, the USAF selected sites for two radar stations on the ice cap in southern Greenland. Dye-2 was to be built approximately 100 miles east of Sondrestrom AB and 90 miles south of the Arctic Circle at an altitude of 7, 600 feet, and Dye-3 was to be located approximately 100 miles east of DYE II and slightly south at an elevation of 8,600 feet.

The selected locations for the new radar sites were found to receive from three to four feet of snow fall each year. Since the winds were constantly blowing with speeds as much as 100 mph, this snow accumulation constantly formed large drifts. To overcome this potential problem, it was decided that the Dye sites should be elevated approximately twenty feet above the surface of the ice cap.

Dye 3 was built in 1960. From a distance the structure, with its onion-shaped dome, looks like a Russian orthodox church. Dye 3 was an ice core site and previously part of the DEW line in Greenland. (The Distant Early Warning (DEW) Line: A Bibliography and Documentary Resource List Arctic Institute of North America, Page 23). As a Distant Early Warning line base, it was disbanded in years 1990/1991. The Dye 3 cores were part of the GISP (Greenland Ice Sheet Project initiated in 1971) and, at 2037 meters, was the deepest of the 20 ice cores recovered from the Greenland ice sheet as part of GISP. Samples from the base of the 2km deep Dye 3 and the 3km deep GRIP cores revealed that high-altitude southern Greenland has been inhabited by a diverse array of conifer trees and insects within the past million years. (Eske Willerslev, et al. (2007) Ancient Biomolecules from Deep Ice Cores Reveal a Forested Southern Greenland Science 317 111-114)

The first image below is from 1972.

image
See larger image here.

Here it is in 2006.

image
See larger image here.

In looking back at the time the sites were abandoned, one console operator lamented “We were very busy during this time and I was sad to see it end. I remember thinking of all the waste,” he said. The site is slowly disappearing into the snow. Its outbuildings are no longer visible and drifting snow will consume it completely one day, but that day appears to be decades away.” Read more here.

album picasa

martes, 30 de diciembre de 2008

Don Easterbrook’s AGU paper on potential global cooling

Don sent me his AGU paper for publication and discussion here on WUWT, and I’m happy to oblige - Anthony

Abstracts of American Geophysical Union annual meeting, San Francisco Dec., 2008

Solar Influence on Recurring Global, Decadal, Climate Cycles Recorded by Glacial Fluctuations, Ice Cores, Sea Surface Temperatures, and Historic Measurements Over the Past Millennium

Easterbrook, Don J., Dept. of Geology, Western Washington University, Bellingham, WA 98225,

Global, cyclic, decadal, climate patterns can be traced over the past millennium in glacier fluctuations, oxygen isotope ratios in ice cores, sea surface temperatures, and historic observations. The recurring climate cycles clearly show that natural climatic warming and cooling have occurred many times, long before increases in anthropogenic atmospheric CO2 levels. The Medieval Warm Period and Little Ice Age are well known examples of such climate changes, but in addition, at least 23 periods of climatic warming and cooling have occurred in the past 500 years. Each period of warming or cooling lasted about 25-30 years (average 27 years). Two cycles of global warming and two of global cooling have occurred during the past century, and the global cooling that has occurred since 1998 is exactly in phase with the long term pattern. Global cooling occurred from 1880 to ~1915; global warming occurred from ~1915 to ~1945; global cooling occurred from ~1945-1977;, global warming occurred from 1977 to 1998; and global cooling has occurred since 1998. All of these global climate changes show exceptionally good correlation with solar variation since the Little Ice Age 400 years ago.

The IPCC predicted global warming of 0.6° C (1° F) by 2011 and 1.2° C (2° F) by 2038, whereas Easterbrook (2001) predicted the beginning of global cooling by 2007 (± 3-5 yrs) and cooling of about 0.3-0.5° C until ~2035. The predicted cooling seems to have already begun. Recent measurements of global temperatures suggest a gradual cooling trend since 1998 and 2007-2008 was a year of sharp global cooling. The cooling trend will likely continue as the sun enters a cycle of lower irradiance and the Pacific Ocean changed from its warm mode to its cool mode.

Comparisons of historic global climate warming and cooling, glacial fluctuations, changes in warm/cool mode of the Pacific Decadal Oscillation (PDO) and the Atlantic Multidecadal Oscillation (AMO), and sun spot activity over the past century show strong correlations and provide a solid data base for future climate change projections. The announcement by NASA that the Pacific Decadal Oscillation (PDO) had shifted to its cool phase is right on schedule as predicted by past climate and PDO changes (Easterbrook, 2001, 2006, 2007) and coincides with recent solar variations. The PDO typically lasts 25-30 years, virtually assuring several decades of global cooling. The IPCC predictions of global temperatures 1° F warmer by 2011, 2° F warmer by 2038, and 10° F by 2100 stand little chance of being correct. “Global warming” (i.e., the warming since 1977) is over!

agu1

Figure 1. Solar irradiance, global climate change, and glacial advances. Click to enlarge

The real question now is not trying to reduce atmospheric CO2 as a means of stopping global warming, but rather (1) how can we best prepare to cope with the 30 years of global cooling that is coming, (2) how cold will it get, and (3) how can we cope with the cooling during a time of exponential population increase? In 1998 when I first predicted a 30-year cooling trend during the first part of this century, I used a very conservative estimate for the depth of cooling, i.e., the 30-years of global cooling that we experienced from ~1945 to 1977. However, also likely are several other possibilities (1) the much deeper cooling that occurred during the 1880 to ~1915 cool period, (2) the still deeper cooling that took place from about 1790 to 1820 during the Dalton sunspot minimum, and (3) the drastic cooling that occurred from 1650 to 1700 during the Maunder sunspot minimum. Figure 2 shows an estimate of what each of these might look like on a projected global climate curve. The top curve is based on the 1945-1977 cool period and the 1977-1998 warm period. The curve beneath is based on the 1890-1915 cool period and 1915-1945 warm period. The bottom curve is what we might expect from a Dalton or Maunder cool period. Only time will tell where we’re headed, but any of the curves are plausible. The sun’s recent behavior suggests we are likely heading for a deeper global cooling than the 1945-1977 cool period and ought to be looking ahead to cope with it.

agu2

Figure 2. Global temperature variation 1900 to 2008 with projections to 2100. Click to enlarge.

The good news is that global warming (i.e., the 1977-1998 warming) is over and atmospheric CO2 is not a vital issue. The bad news is that cold conditions kill more people than warm conditions, so we are in for bigger problems than we might have experienced if global warming had continued. Mortality data from 1979-2002 death certificate records show twice as many deaths directly from extreme cold than for deaths from extreme heat, 8 times as many deaths as those from floods, and 30 times as many as from hurricanes. The number of deaths indirectly related to cold is many times worse.

Depending on how cold the present 30-year cooling period gets, in addition to the higher death rates, we will have to contend with diminished growing seasons and increasing crop failures with food shortages in third world countries, increasing energy demands, changing environments, increasing medical costs from diseases (especially flu), increasing transportation costs and interruptions, and many other ramifications associated with colder climate. The degree to which we may be prepared to cope with these problems may be significantly affected by how much money we waste chasing the CO2 fantasy.

All of these problems will be exacerbated by the soaring human population. The current world population of about 6 ½ billion people is projected to increase by almost 50% during the next 30 years of global cooling (Figure 2). The problems associated with the global cooling would be bad enough at current population levels. Think what they will be with the added demands from an additional three billion people, especially if we have uselessly spent trillions of dollars needlessly trying to reduce atmospheric CO2, leaving insufficient funds to cope with the real problems.

agu3

Figure 3. Global population.

box net

lunes, 29 de diciembre de 2008

flickr

aniHPIM1890

aqui os pongo unas fotos que
saque en la plaza de america
en la noche de fin de año


domingo, 28 de diciembre de 2008

Half of the USA is covered in snow

25 12 2008

This is something you don’t see every day. We recently heard that Canada had a white Christmas EVERYWHERE, the first time in four decades. Here we see that the USA has an increased albedo (surface reflectivity) for about 1/2 of it’s land area. The increased albedo combined with low sun angle this time of year conspires to keep ice and snow unmelted.

Look for a long and extended winter weather pattern as we head towards the spring equinox, which can’t get here fast enough.

Here is a more colorful view of snow depth on Dec 25th from the National Hydrologic Remote Sensing Center:

El carbono en Africa


Deberían ser los biólogos o los químicos los que dijeran basta! a la estúpida proliferación de la idea, que se fomenta en escuelas y colegios, de que el CO2 es un elemento sucio, artificial y dañino para la vida de la humanidad y del planeta.

El carbono, que en el aire adopta esencialmente la forma oxigenada de CO2, y también de metano, CH4, es el elemento esencial de la vida terrestre. Para comprender la vida de este planeta cualquier estudiante debería empezar reflexionando sobre los intercambios de carbono entre el aire, los océanos, las plantas y los suelos. En vez de eso, lo que predomina es la ideología histérica que predica la descarbonización del mundo, que empieza por pedir que se cierren las centrales térmicas, que sigue por la prohibición de comer chuletas, y que acaba por volver anoréxica a la humanidad y a su economía.

Por eso esta mañana, cuando buscaba otra cosa en mi ordenador y he encontrado el dibujo de arriba, me han entrado ganas de ponerlo aquí y de explicarlo de forma sencilla. Sin más.

Trata de los intercambios de carbono en el continente africano. Los números indican las cantidades de carbono intercambiadas entre el aire, el suelo y las plantas, calculadas en gigatoneladas de carbono al año (una gigatonelada equivale a un petagramo o, lo que es lo mismo, a "10 elevado a la quince" gramos) y referidas a los años 90. Los dos números entre paréntesis indican las cantidades de carbono, más o menos inmutables, que en cualquier momento se encuentran en las plantas de Africa (80 gigatoneladas) y en los suelos de Africa (200 gigatoneladas).

Las plantas en Africa absorben cada año 10 gigatoneladas de carbono (NPP, producción primaria neta: lo absorbido por fotosíntesis menos lo perdido en la respiración de las propias plantas). Por su parte los suelos emiten 11 gigatonelas de carbono por la respiración (Rh, respiración heterótrofa) de los microorganismos que en él habitan y que se alimentan del carbono de las plantas muertas.

La intervención humana en el ciclo se manifiesta en la emisión de carbono al aire por tres procesos diferentes. a) La quema de combustibles fósiles y la fabricación de cemento (0,2 gigatoneladas/año). b) La deforestación (0,4 gigatonelas/año) y c) por las quemas agrícolas de las sabanas (1,1 gigatonelas/año) que se efectúan anualmente antes de la época de siembra. Estas emisiones de carbono en la sabana no son sólo en forma de CO2 sino también de metano, CH4. ¿Es malo eso?. No lo sé, habría que preguntárselo a los elefantes. Pero, en fin, no es como para desesperarse.

Temperatura global 2001-2008


El mapamundi de arriba representa el cambio de temperatura a lo ancho y largo del planeta en el siglo actual, durante el período 2001-2008 (para ser exactos, entre Diciembre 2000 y Noviembre 2008). La media global del cambio (diferencia entre los extremos de la tendencia lineal) es casi nula: 0,01 ºC.

A diferencia de lo que suele ser más frecuente, utilizo un tipo de mapa, o proyección cartográfica, que conserva la proporción de las áreas. Por ejemplo, Africa aparece con relación al resto del globo tan grande como realmente es y no se exageran, como se suele hacer, las áreas de las latitudes altas. Por eso, el calentamiento registrado en el Artico Oriental aparece restringido a una estrecha zona de color rojo oscuro. No se puede extrapolar el calentamiento del Artico a todo el globo. Incluso en su extremo occidental, en Alaska, lo que ha habido estos años es un enfriamiento. Y en el polo sur tampoco se ha notado el efecto invernadero del CO2 que, gracias al viento, ha aumentado por igual en todas partes.

El mapa lo tomo de los datos del Instituto Goddard de la NASA, GISS, cuyo director, James Hansen, es uno de los gurús del calentamiento climático, tipo Madoff, el que fue director del Nasdaq y a quien ahora obligan a hablar menos y dormir en casa.

domingo, 21 de diciembre de 2008

album con flickr

ALBUM CREADO CON FLICKR


Photobucket

martes, 9 de diciembre de 2008

Eólicas: menos lobos.

Tuesday, November 25, 2008

Eólicas: menos lobos.


Lo que ha chutado este año en la producción eléctrica española es el gas, no la energía éolica.

A falta de poco más de un mes para que acabe 2008, la producción eléctrica proveniente de las centrales de ciclo combinado que utilizan gas natural como combustible ha aumentado en términos absolutos diez veces más que la producción eólica, con respecto al mismo período del año pasado.

Es más, incluso la producción nuclear ha aumentado más que la eólica.

El gran avance del gas se ha debido al gran retroceso del carbón, que este año se ha visto gravado con una enorme tasa debida al sistema establecido por el protocolo de Kioto. El carbón emite el doble de CO2 que el gas por unidad de energía producida y por lo tanto Kioto le perjudica el doble.

En los próximos meses, lo mismo que baja la gasolina porque baja el petróleo, debería bajar la electricidad si bajan los precios del gas y del carbón. Y vaya que sí lo hacen.

Pero como saben ustedes, gracias a la santa unión de ecologistas, sindicalistas y capitalistas, lo que ocurrirá es lo contrario: pagaremos más. Y con gusto, ya que es el día del club y todos somos "seguidores del planeta", como dice la publicidad de Iberdrola.

ref.: www.ree.es - Red Eléctrica de España
gráfico de elaboración propia a partir de datos del Boletín Diario 25 Nov. 2008

Sunday, November 23, 2008

Cuando Obama estuvo en Ponferrada

No, no estuvo nunca, me he equivocado. Donde sí estuvo Obama fue en Kentucky hace unos meses, en la campaña electoral, y allí repartió el pasquín de propaganda que ilustra este post. Barack Obama cree en el limpio carbón de Kentucky. Cuando va a California, tierra de ecologistas y de vigilantes de la playa, el futuro presidente echa pestes contra las centrales térmicas de carbón, pero cuando va a Kentucky ya es otra cosa. Menos mal.

He confundido Kentucky con El Bierzo, en donde el gobierno español promociona también lo que se llama el "carbón limpio" (clean coal). Parece que el ministro Sebastián ha optado definitivamente por que se desarrolle el tema en Ponferrada (La Nueva España). Como ya lo expliqué hace un par de años (co2: Carbón limpio) , se entiende por carbón limpio un procedimiento por el cual tras la combustión del carbón en las centrales térmicas se recoge el CO2 emitido y se guarda bajo tierra, para cuando haya ocasión de usarlo.

De esto del "carbón limpio" no se habla mucho porque no gusta nada ni a los de las renovables, ni a los de las nucleares. Los primeros dicen que es muy peligroso guardar el CO2 (ya saben, para ellos el CO2 es tóxico) y los segundos dicen que eso de capturarlo y almacenarlo va a ser muy caro e inviable. Lo que ocurre es que si el procedimiento sale bien, ya no habrá excusa para que sigan urbanizando el monte plantándonos aerogeneradores por todas partes, ni tampoco para que nos embarquen en la complicación y el centralismo vigilado de las nucleares.